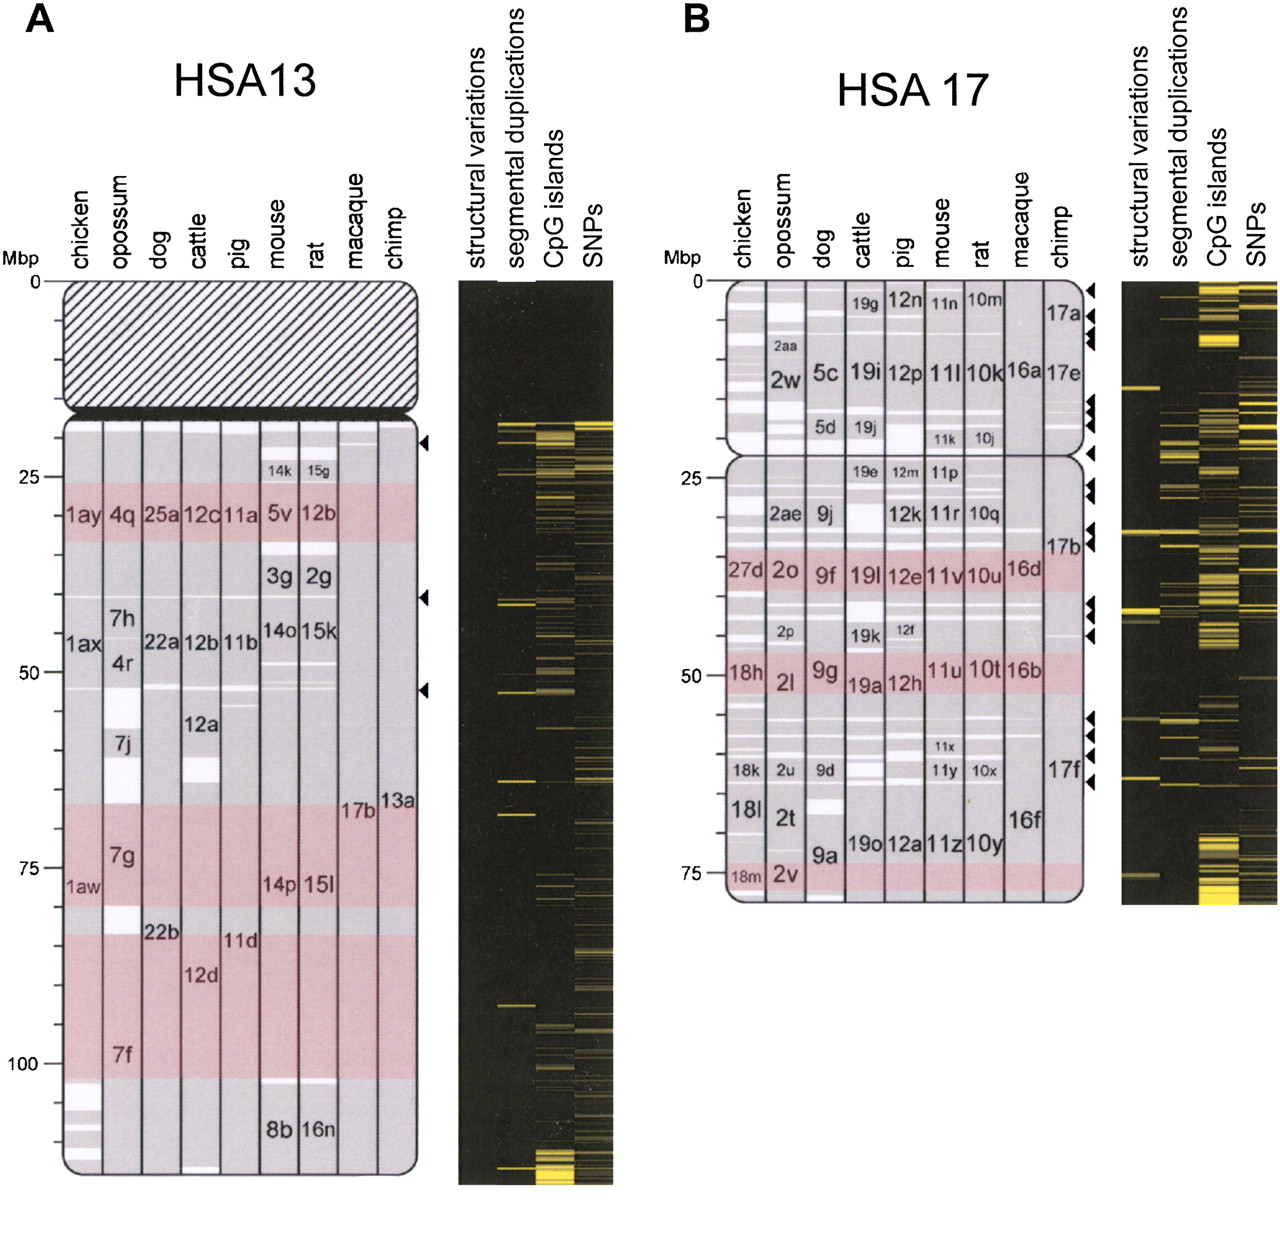
Multispecies comparative chromosome architecture of HSA13 and HSA17. Multispecies alignment of HSBs on HSA13 (A) and HSA17 (B) as visualized with the Evolution Highway comparative chromosome browser. HSA13 and HSA17 were selected for display because they represent extremes in terms of chromosome rearrangements in primates and because of their differences in sequence feature distribution. The remaining multispecies maps showing full representation of all HSBs and sequence feature heat maps can be visualized using Evolution Highway (http://evolutionhighway.ncsa.uiuc.edu). Gray blocks indicate HSBs, with the species chromosome number indicated inside the bars. The identification of smaller HSBs is hidden in order to improve visualization and data interpretation. The lowercase letters indicate the sequential order of the HSB in that species' chromosome (in alphabetical order, with second alphabet used for chicken HSBs). A new alphabet is used for each chromosome. The borders of the red-shaded blocks indicate the sequence boundaries of the largest msHSBs on each chromosome. The EBRs are represented by white areas between HSBs. Sequence feature heat maps are to the right of each chromosome idiogram. Primate-specific EBRs are indicated by arrowheads. The underlying data for the sequence features were taken from the UCSC Genome Browser. Statistical comparisons for the 10 sequence features analyzed are given in Table 2. The selected sequence features are significantly more dense in either EBRs or HSBs than the average in the remainder of the genome for each comparison (Bonferroni adjusted P < 0.05). Copy number variants and indels (structural variants track from the UCSC Genome Browser) and segmental duplication can be observed to align with primate specific EBRs. The segmental duplications track is shown to illustrate consistency with previous results (Murphy et al. 2005). The heat maps show visually that HSA17 is more gene-dense and CpG islands are clustered in and around EBRs and telomeres.