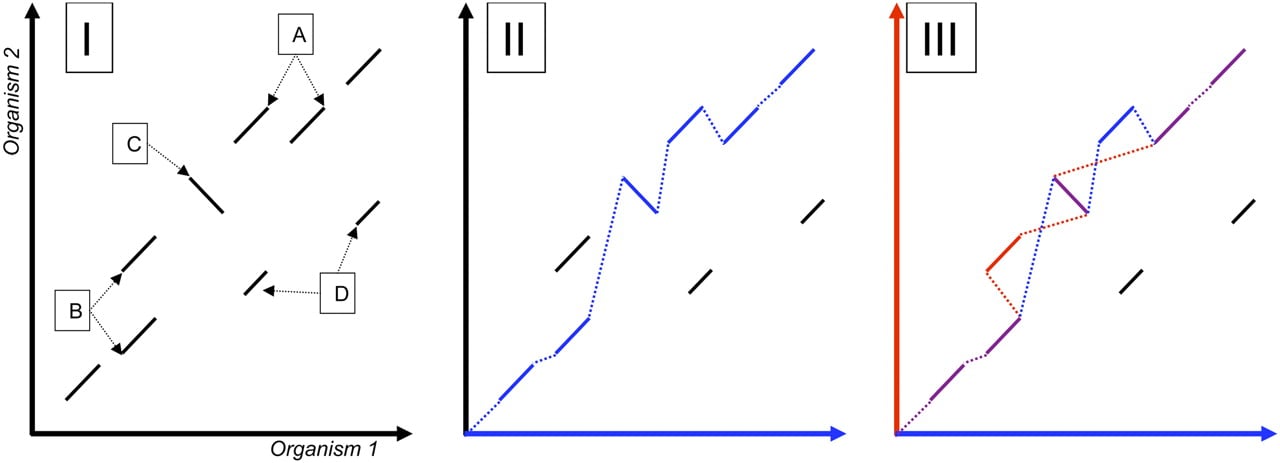
SuperMap Algorithm. The left side (I) is a dotplot demonstrating the local alignments between two hypothetical genomes. Local alignments A and B correspond to duplications in Organism 1 and Organism 2, respectively. Local alignment C corresponds to an inversion, and local alignments D are spurious false positives. The middle panel (II) shows (in blue) the result of running the regular S-LAGAN 1-monotonic chaining algorithm using Organism 1 as the base. On the right (III) we have built the 1-monotonic maps for Organism 1 (blue) and 2 (red). Whenever these chains merge, they are shown as purple. Similarly, local alignments are colored based on which chains they belong to blue (M1), red (M2), or purple (both, DM). All points where the two chains split or join are borders of a region of conserved synteny.