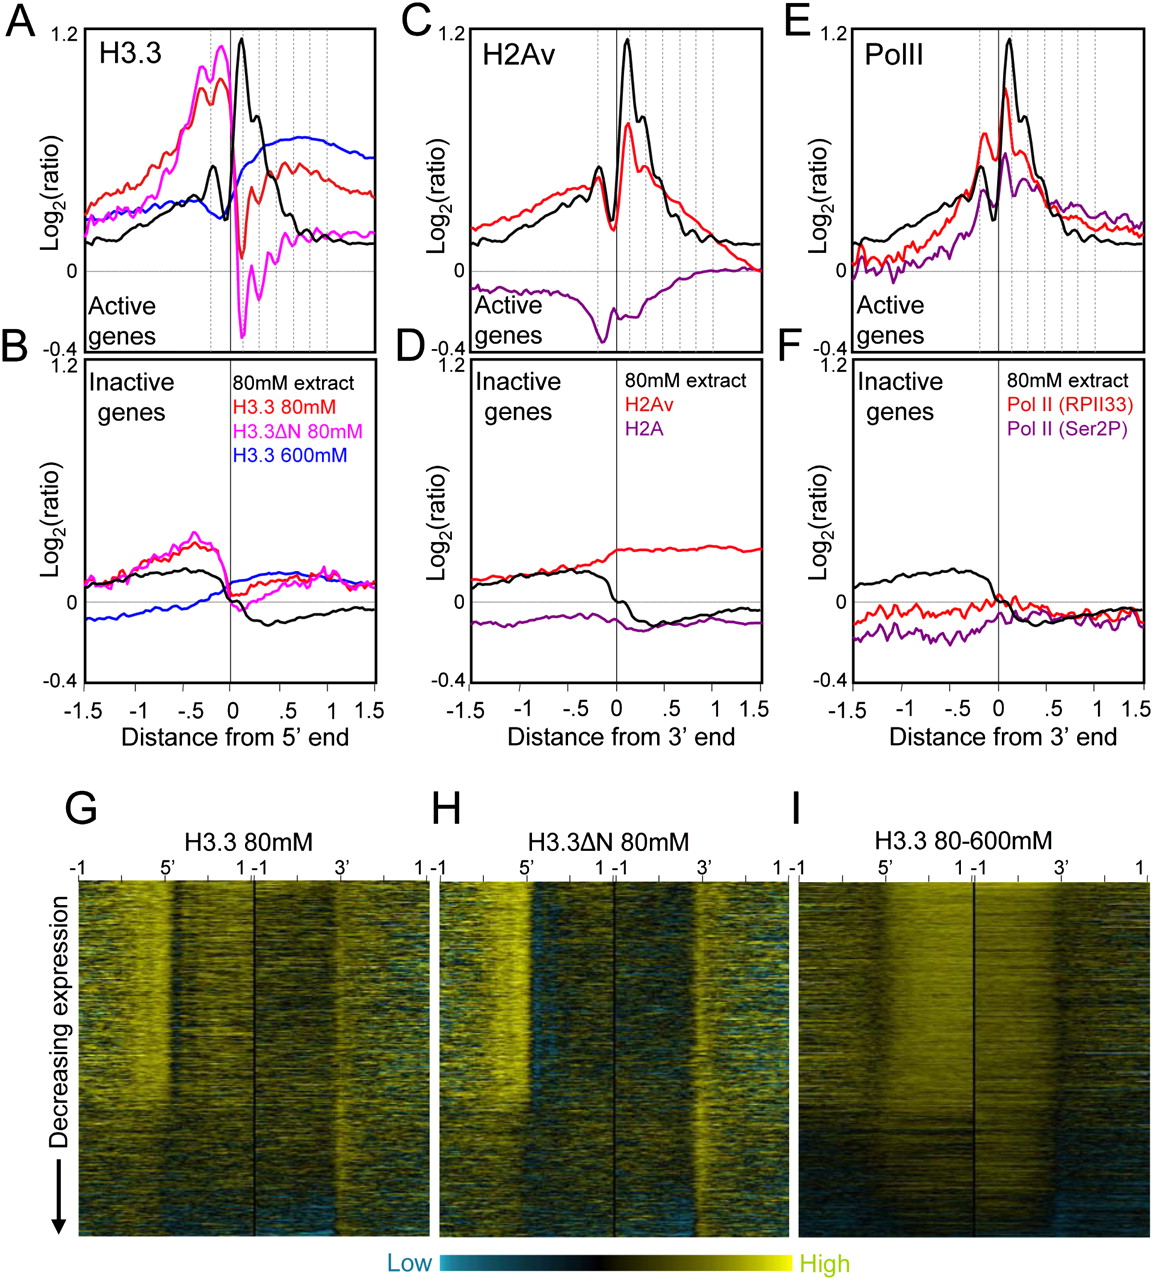
H3.3-enriched low-salt soluble nucleosomes occupy active promoters. (A) Ends analyses of H3.3 obtained from salt fractions as indicated for active genes. H3.3 peaks are out-of-phase with low-salt soluble chromatin peaks (dotted vertical lines). (B) same as A except for inactive genes. To separate active and inactive genes, loci were rank-ordered based on expression levels in Supplemental Table S1. For simplicity, genes were divided into active and inactive fractions based on the visible discontinuity in salt solubility and H3.3 heat maps after rank-ordering by expression (Fig. 3G). For comparison, profiles are shown for 80 mM salt-extraction averaged from eight experiments (black curve). (C) Ends analyses of H2Av and H2A obtained by pulldown of biotin-tagged variants after a low-salt/EDTA/shearing extraction procedure (Jin and Felsenfeld 2007), showing active gene profiles. (D) Same as C except for inactive genes. (E) Ends analyses of Pol II ChIP-chip of S2 cell chromatin using RPII33 and Ser2P antibodies (Muse et al. 2007). Profiles for active genes are shown together with low-salt chromatin peaks (dotted lines), which align with but are slightly offset from Pol II peaks. (F) Same as E except for inactive genes. (G) Heat map display of H3.3/input for chromatin from an 80 mM extract. Contrast levels are equal for all stacks (Java TreeView setting of 2.0). (H) Same as G but for H3.3ΔN 80 mM. (I) Same as G but for the corresponding 80–600 mM extract.