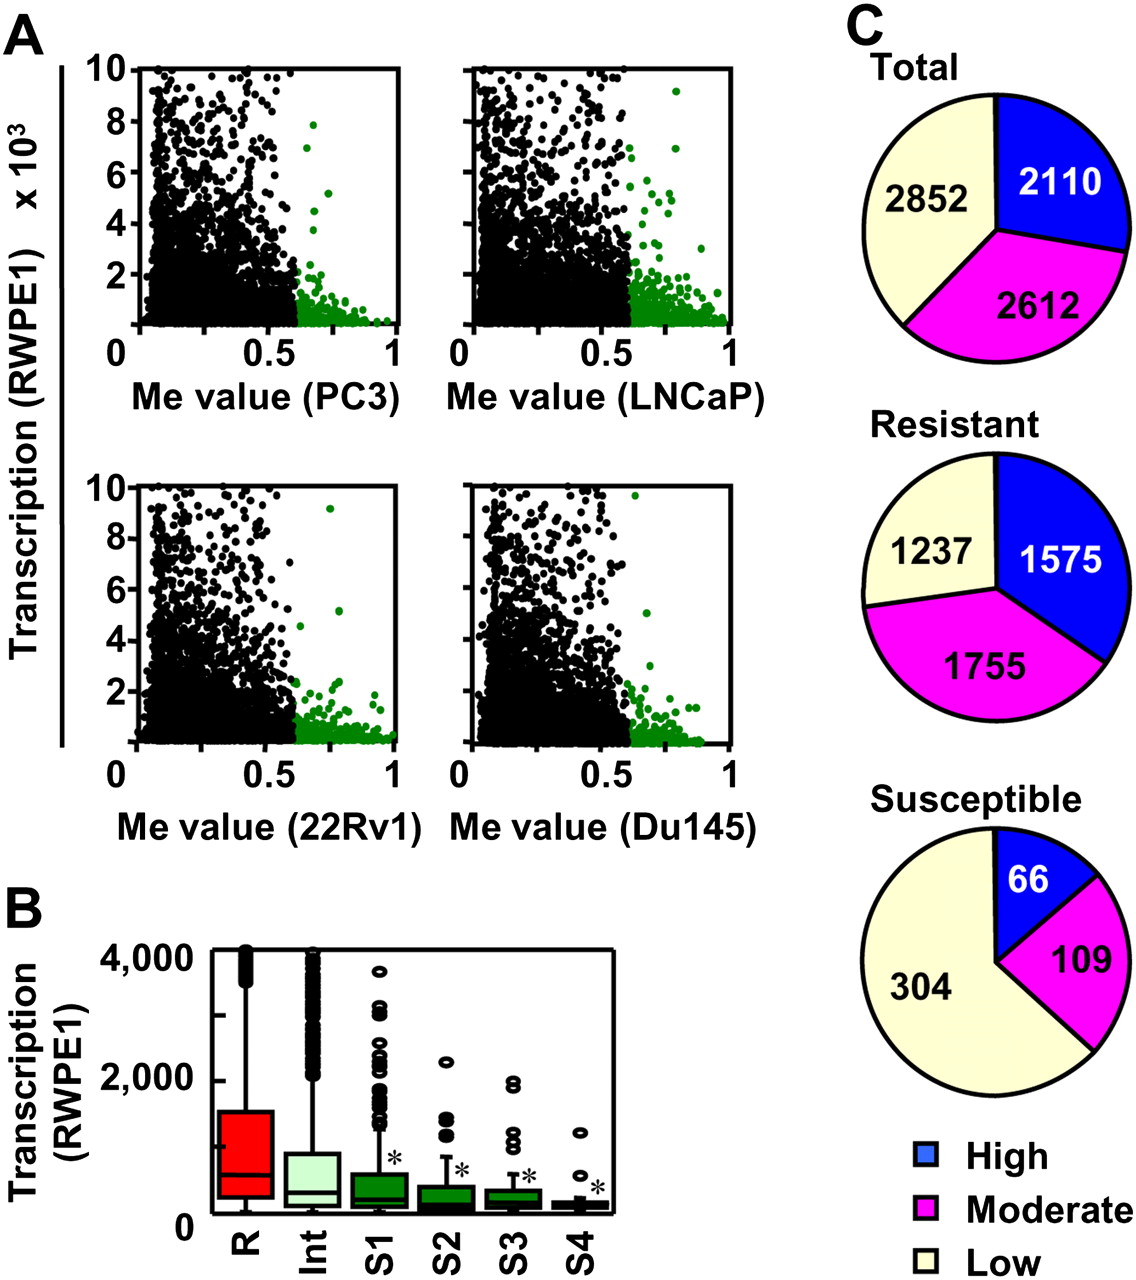
Low transcription levels of DNA methylation-susceptible genes in the normal prostatic cell line (RWPE1). (A) The association between DNA methylation levels (Me value of the NFRs) in each of the four prostate cancer cell lines (PC3, LNCaP, 22Rv1, and Du145) and transcription levels in RWPE1. (Green dots) Genes highly methylated in a cancer cell line. Genes highly methylated in a cancer cell line had low transcription levels in the normal cell line. (B) Transcription levels of resistant (R), intermediate (Int), and susceptible (S1–S4) genes in RWPE1. The boxes represent the 75th and 25th percentiles, and the line in the box represents the 50th percentile (the median). Whiskers represent the maximum data within (75th percentile + 1.5 × [75th percentile − 25th percentile]) and the minimum data within (25th percentile − 1.5 × [75th percentile − 25th percentile]). (Dots) The data not included between the whiskers. Transcription levels of Int, S1, S2, S3, and S4 were compared to that of R by the Mann-Whitney U-test (*P < 1 × 10⁻⁵). Susceptible genes had significantly lower expression levels than resistant genes. (C) The fraction of genes with high (blue) (signal intensity > 1000), moderate (pink) (250–1000), and low (yellow) (<250) transcription. Susceptible genes had a significantly larger fraction of genes with low transcription than the total genes.