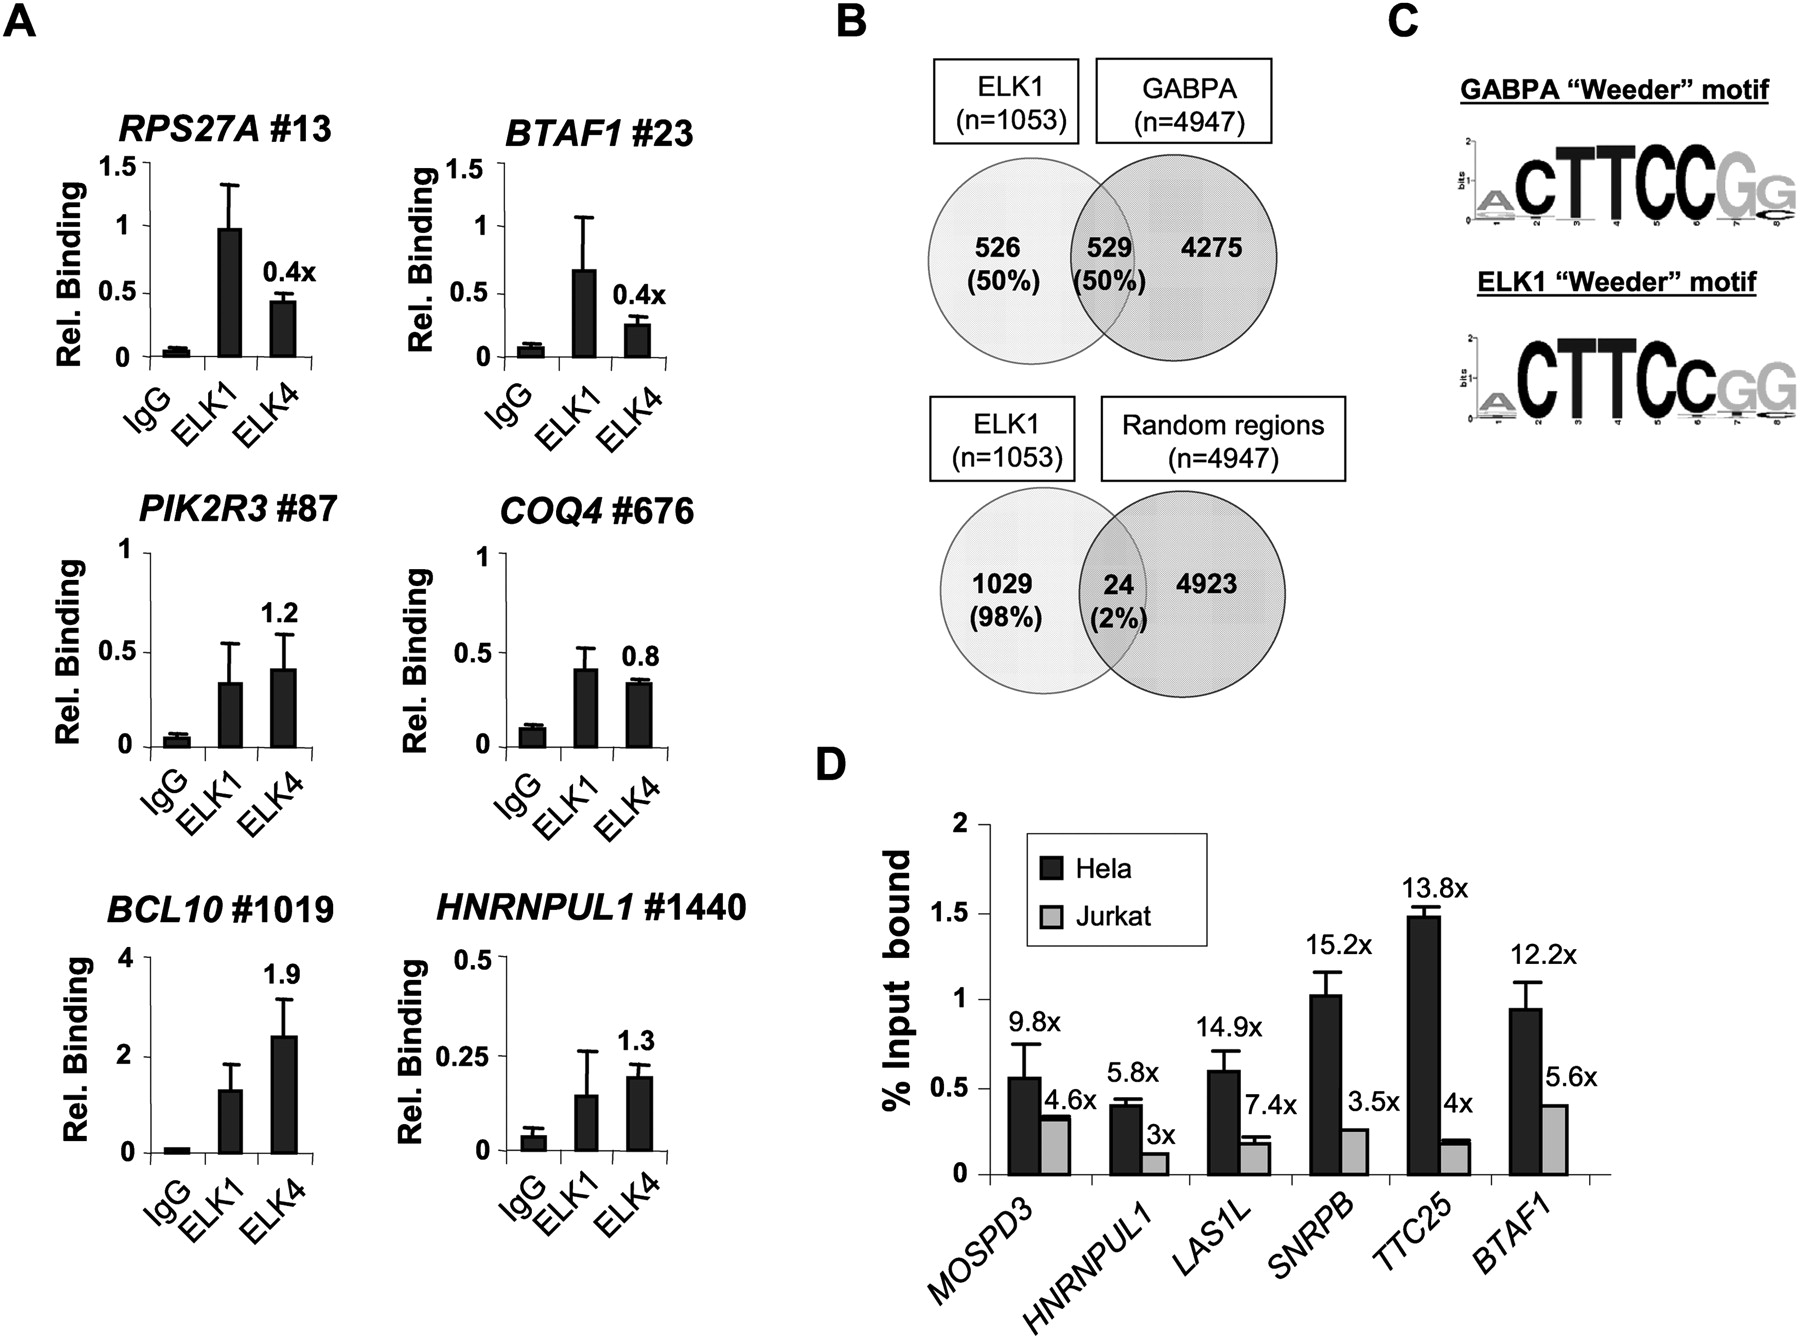
Redundant promoter occupancy by ELK1 and other ETS-domain transcription factors. (A) qPCR-ChIP analysis of ELK1 and ELK4 binding to ELK1 target regions. The position of the binding region on the ranked target list is shown next to the gene name. Data are the average of duplicate samples and representative of three independent experiments. Relative binding ratios of ELK4 versus ELK1 are shown above the bars corresponding to ELK4. (B) Overlap in binding regions between ELK1 (FDR < 10) and GABPA ChIP-seq (Valouev et al. 2008) datasets. Comparisons were made with GABPA-binding regions that overlap with the tiled regions on the Affymetrix promoter arrays. The overlap between ELK1-binding regions and random equivalently sized promoter datasets is given for comparison. The total number of genes in each sector is shown, with percentages provided relative to the total number of ELK1 targets. (C) Sequence logo representation of the top 8-bp sequence identified by de novo searching the top 1000 binding regions identified as GABPA targets by ChIP-seq (±100 bp of midpoint) or the ELK1 FDR < 10 ChIP-chip datasets by Weeder. (D) qPCR-ChIP analysis of ELK1 binding to a set of promoters identified as binding to both ELK1 and GABPA. Data are presented as percent input bound in either HeLa (black bars) or Jurkat (gray bars) cells. Fold enrichment over IgG control precipitations is shown above each graph. Data are the average of duplicate samples from three independent experiments.