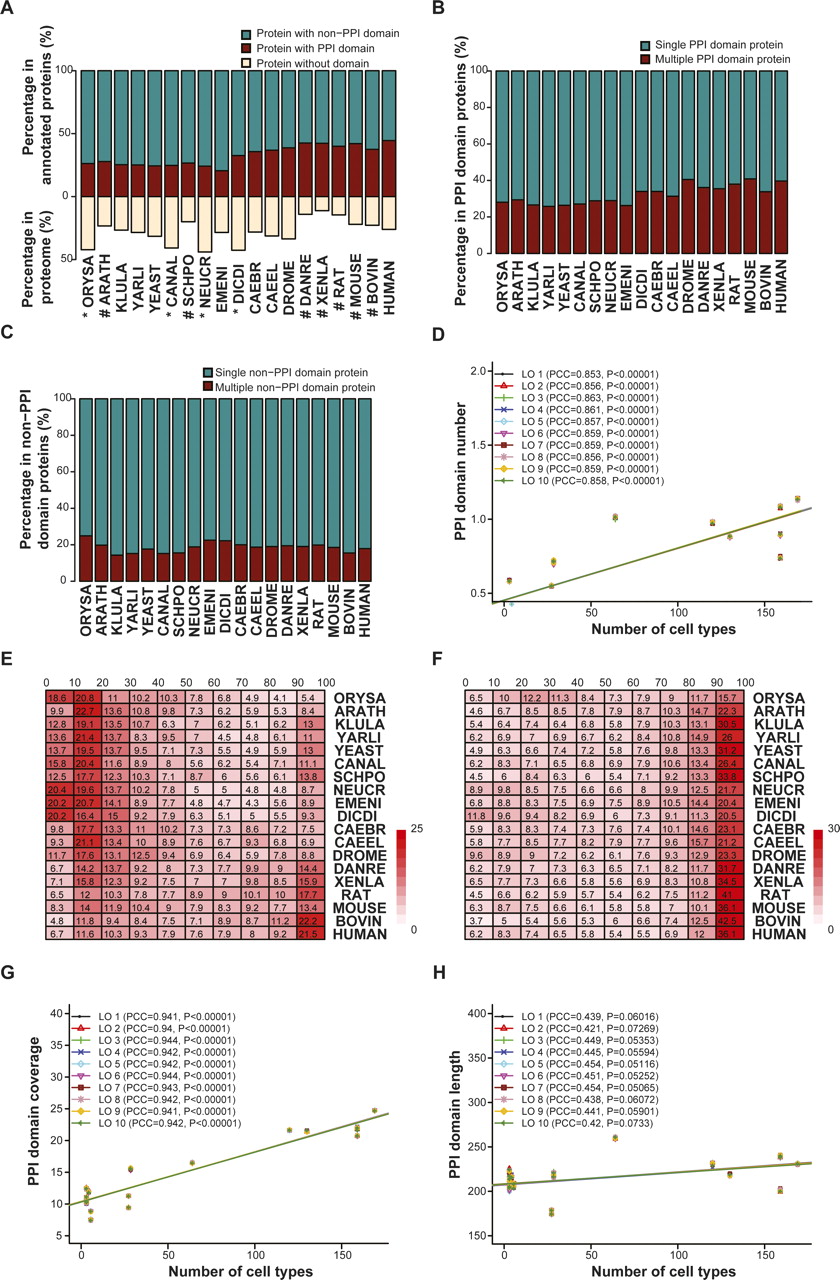
Evolutionary structural adaptations toward PPI domain expansion at the individual protein level. (A) The percentage of proteins with PPI domains (maroon blocks), other non-PPI domains (cyan blocks) among all proteins with domain annotation in each organism (above X-axis), and those without any annotated domains (beige blocks) in the proteomes of different organisms (below X-axis). The organisms that are significantly under- or overannotated for domains are indicated by asterisks or pound signs before their names. (B) Percentage of proteins with single (cyan) or multiple (maroon) PPI domains in different organisms among PPI domain-containing proteins. (C) Percentage of proteins with single (cyan) or multiple (maroon) non-PPI domains in different organisms among non-PPI domain-containing proteins. (D) The relationship of the number of PPI domains per protein to the number of cell types in an organism in each of the leave-one-out nine-group combinations (LO1 ∼ 10). The 10 regression lines, PCCs, and linear regression slope P-values result from 10 leave-one-out analyses, one for each nine out of the 10 random protein groups (same for G and H). (E) Distribution of PPI domain coverage. Proteins in each organism are divided into 10 groups based on their PPI domain coverage. The boundaries of each PPI domain coverage interval are shown on the top of the plot. The numbers in the grid give the percentage of the total domain-annotated proteins in each organism that belong to a certain PPI domain coverage interval. The color intensity in each cell is proportional to the relative percentages within each organism (row). (F) Distribution of non-PPI domain coverage. The color intensity and number inside each grid are denoted as in E, except that PPI domains are replaced by non-PPI domains. (G) The relationship of average PPI domain coverage to the number of cell types in an organism in each of the leave-one-out nine-group combinations (LO1 ∼ 10). (H) The relationship of average length of PPI domains to the number of cell types in an organism in each of the leave-one-out nine-group combinations (LO1 ∼ 10).