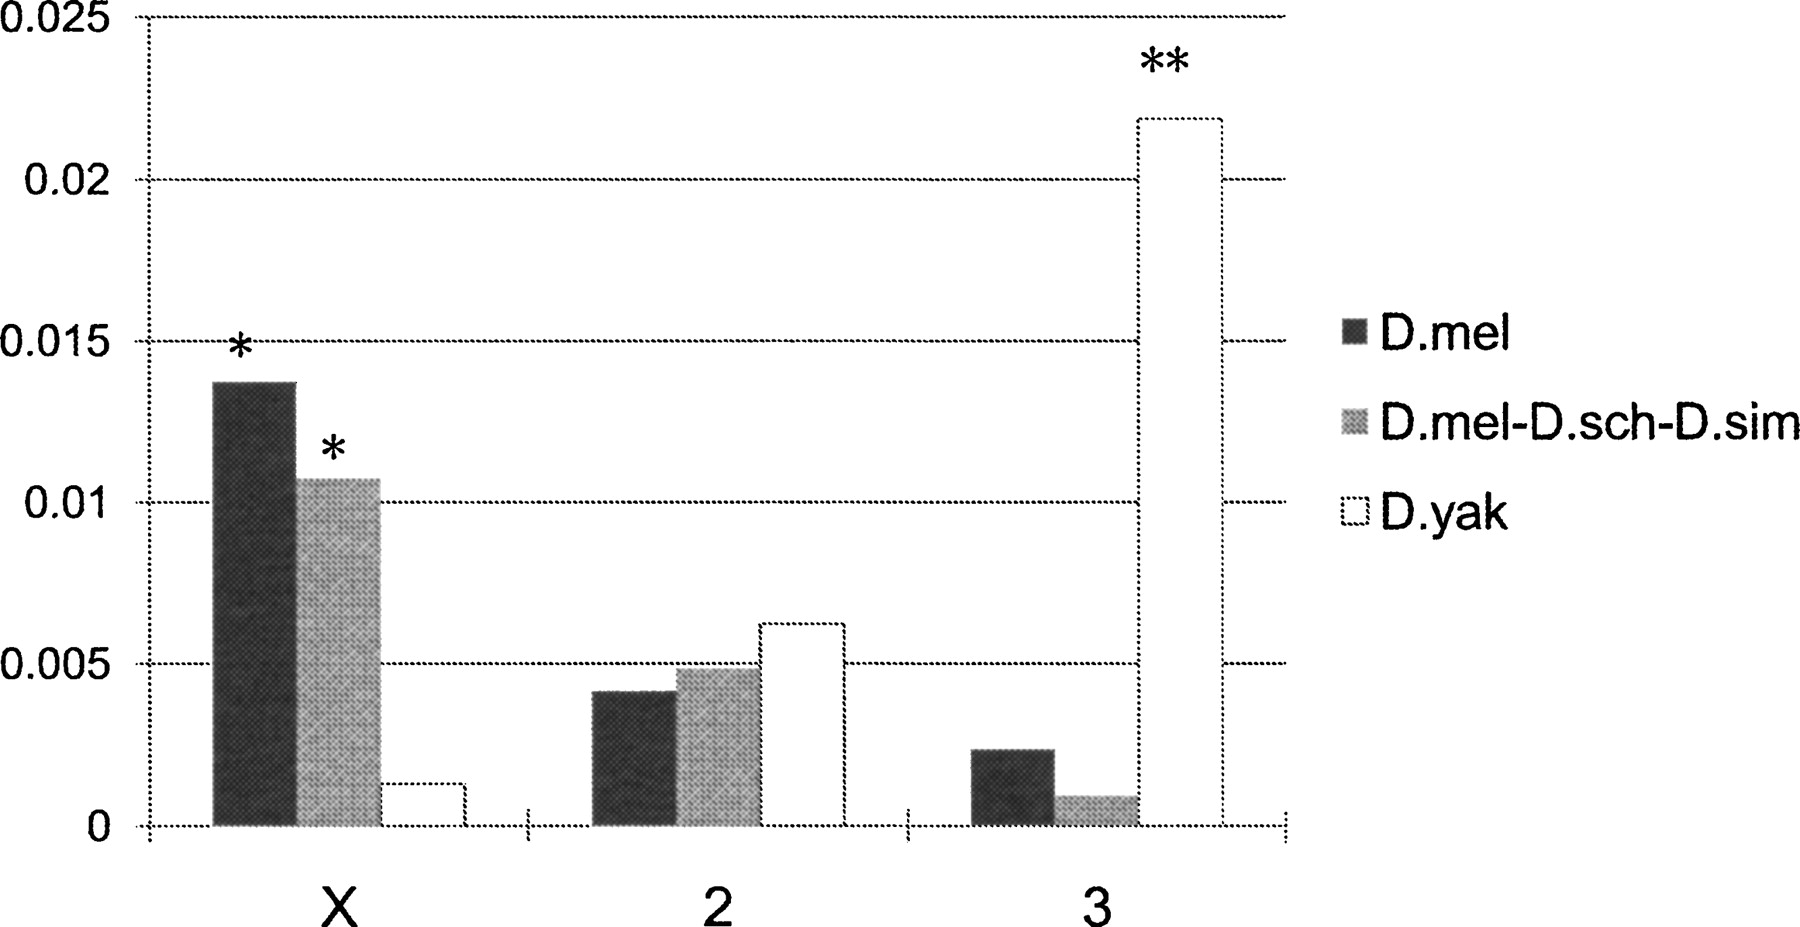
Figure 4.
Chromosomal distribution of new genes in three datasets. New gene numbers were divided by total gene numbers on the specific chromosome as a normalization. We marked significant (*P < 0.01, Fisher’s exact test) and highly significant (**P < 0.001) overrepresentation with of new genes on certain chromosomes. We didn’t take chromosome 4 into account given the extremely low gene number on this chromosome.