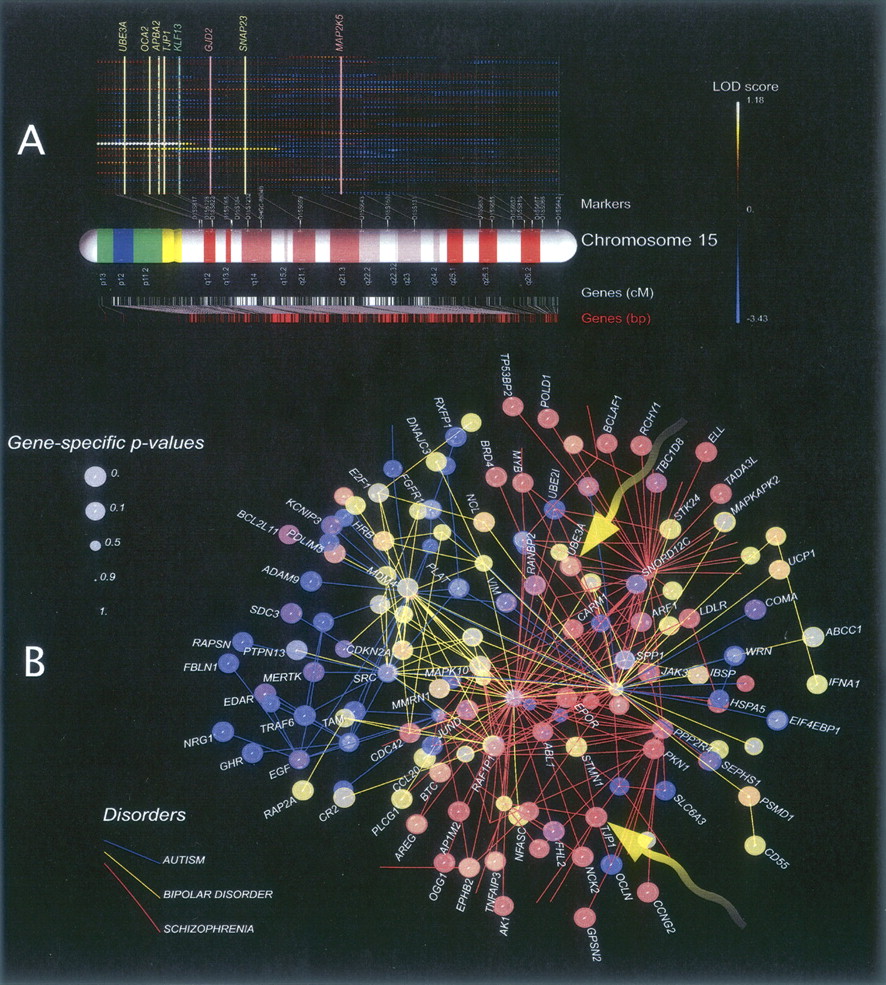
An example of genetic-linkage data used as the input to our analysis and the resulting network of top-scoring genes for the three disorders. (A) Standard multipoint-linkage analysis of human chromosome 15 for 94 schizophrenia families (schizophrenia-no-x analysis). Each line above the chromosome map represents the linkage signal for one family. Also shown are the positions of genetic markers on the chromosome map and the set of top-scoring candidate genes. In this case, four genes (CYFIP1, UBE3A, OCA2, and TJP1) have significant linkage statistics. (B) The molecular network obtained by superimposition of the 70 best 10-gene clusters for each of the three disorders analyzed in this study (autism-no-x, bipolar-no-x, and schizophrenia-no-x analyses). Arrows indicate two genes (UBE3A and TJP1) discussed in the main text. Note that the COMA and TAM genes are not yet approved by HUGO (see the genes_not_in_HUGO.xls supplemental file).