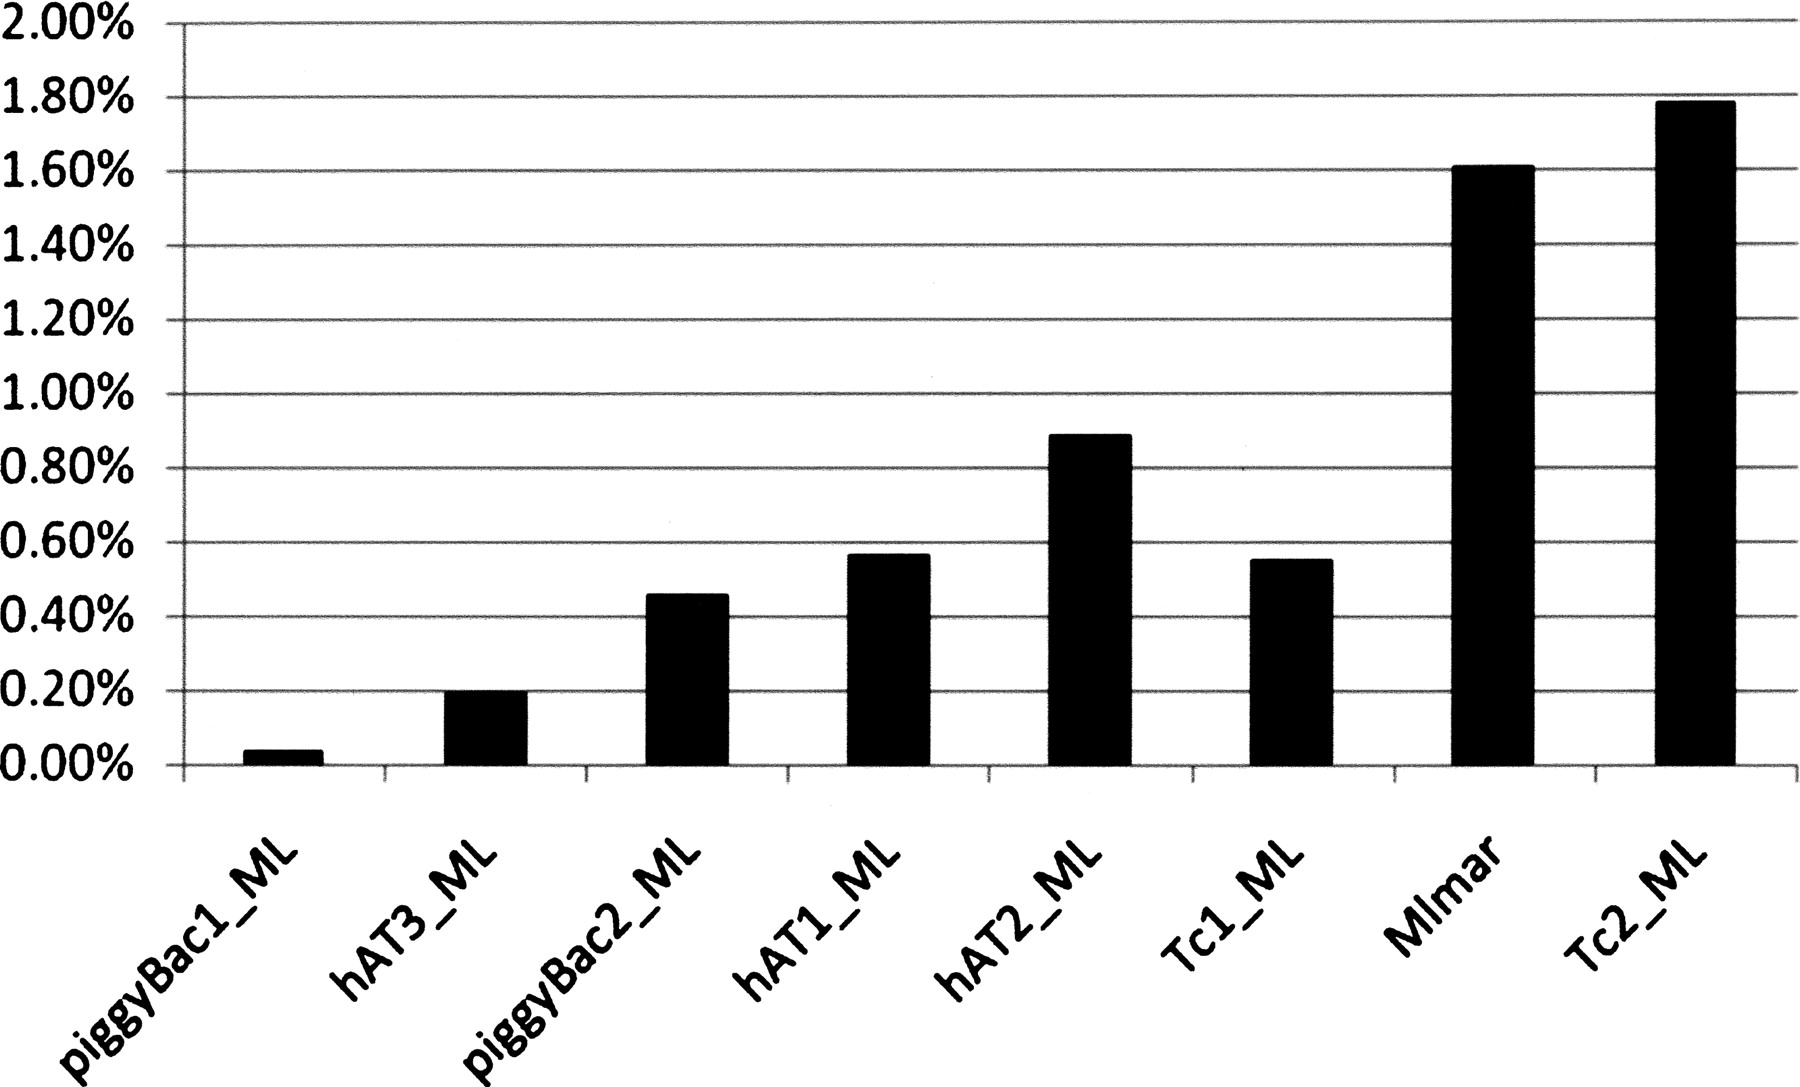
Proportion of insertions nested within instances of each DNA transposon family described. Families are arranged along the X-axis in order of age based on genetic divergence estimates in Table 3. Precise values for can be found in Table 3.