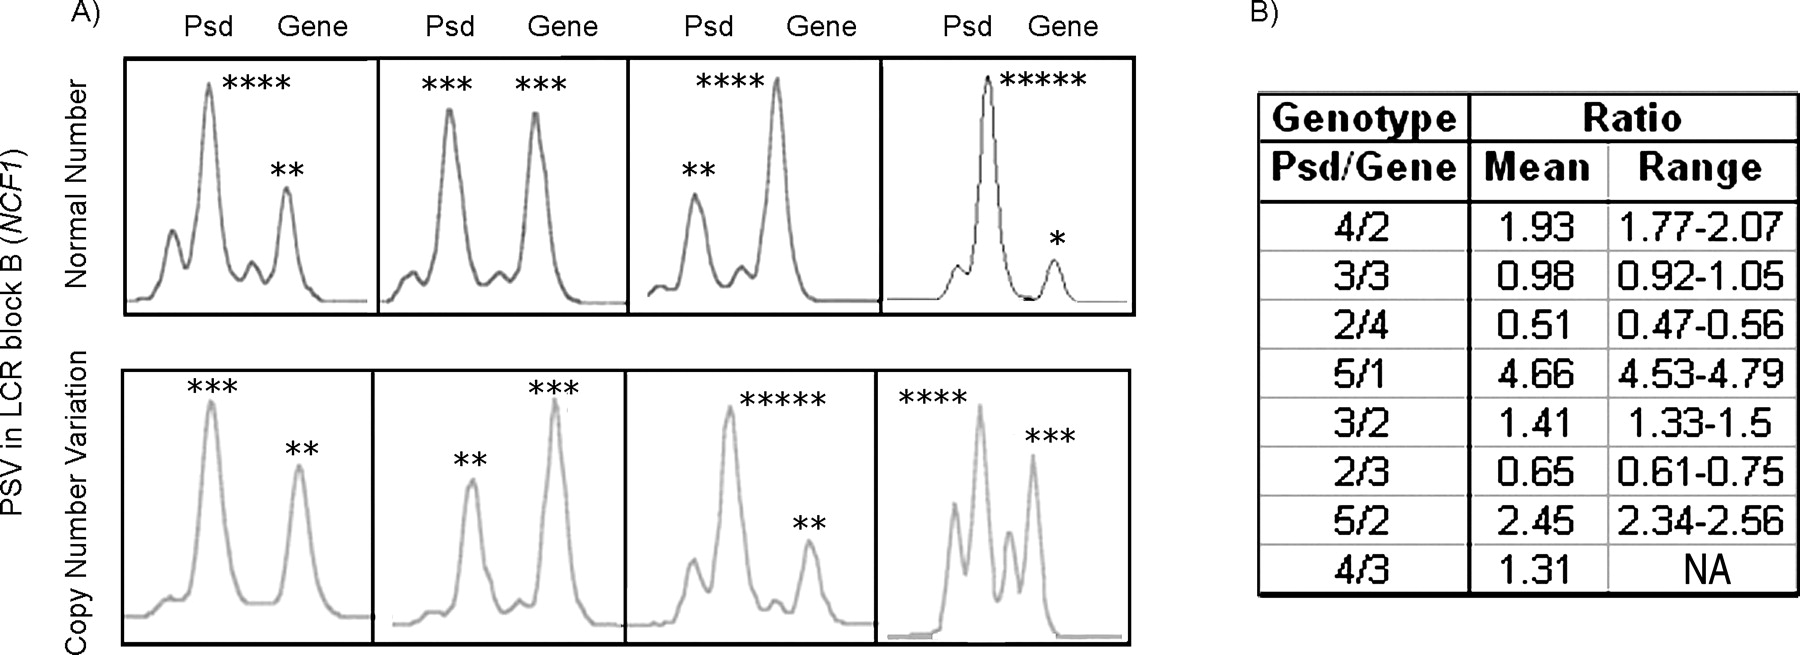
Representative genotypes at the indel-type PSV of exon 2 of NCF1 in individuals with different pseudogene/gene copy numbers. (A) Each panel includes a genotype with two peaks corresponding to the PCR amplicons of the NCF1 pseudogene (Psd, ΔGT) and gene (GT) copies from several individuals. The predicted number of NCF1 pseudogene and gene copies is shown with asterisks on top of each peak. Note that some variability of the relative ratios without affecting the total number of copies (upper panel) is observed among individuals in the normal population likely generated by gene conversion between the gene and pseudogenes. The lower panel shows the genotypes of individuals with either deletion-type or duplication-type CNVs affecting block B of the WBS LCRs. (B) The actual Psd/Gene peak ratio values (mean and range) obtained for each predicted genotype.