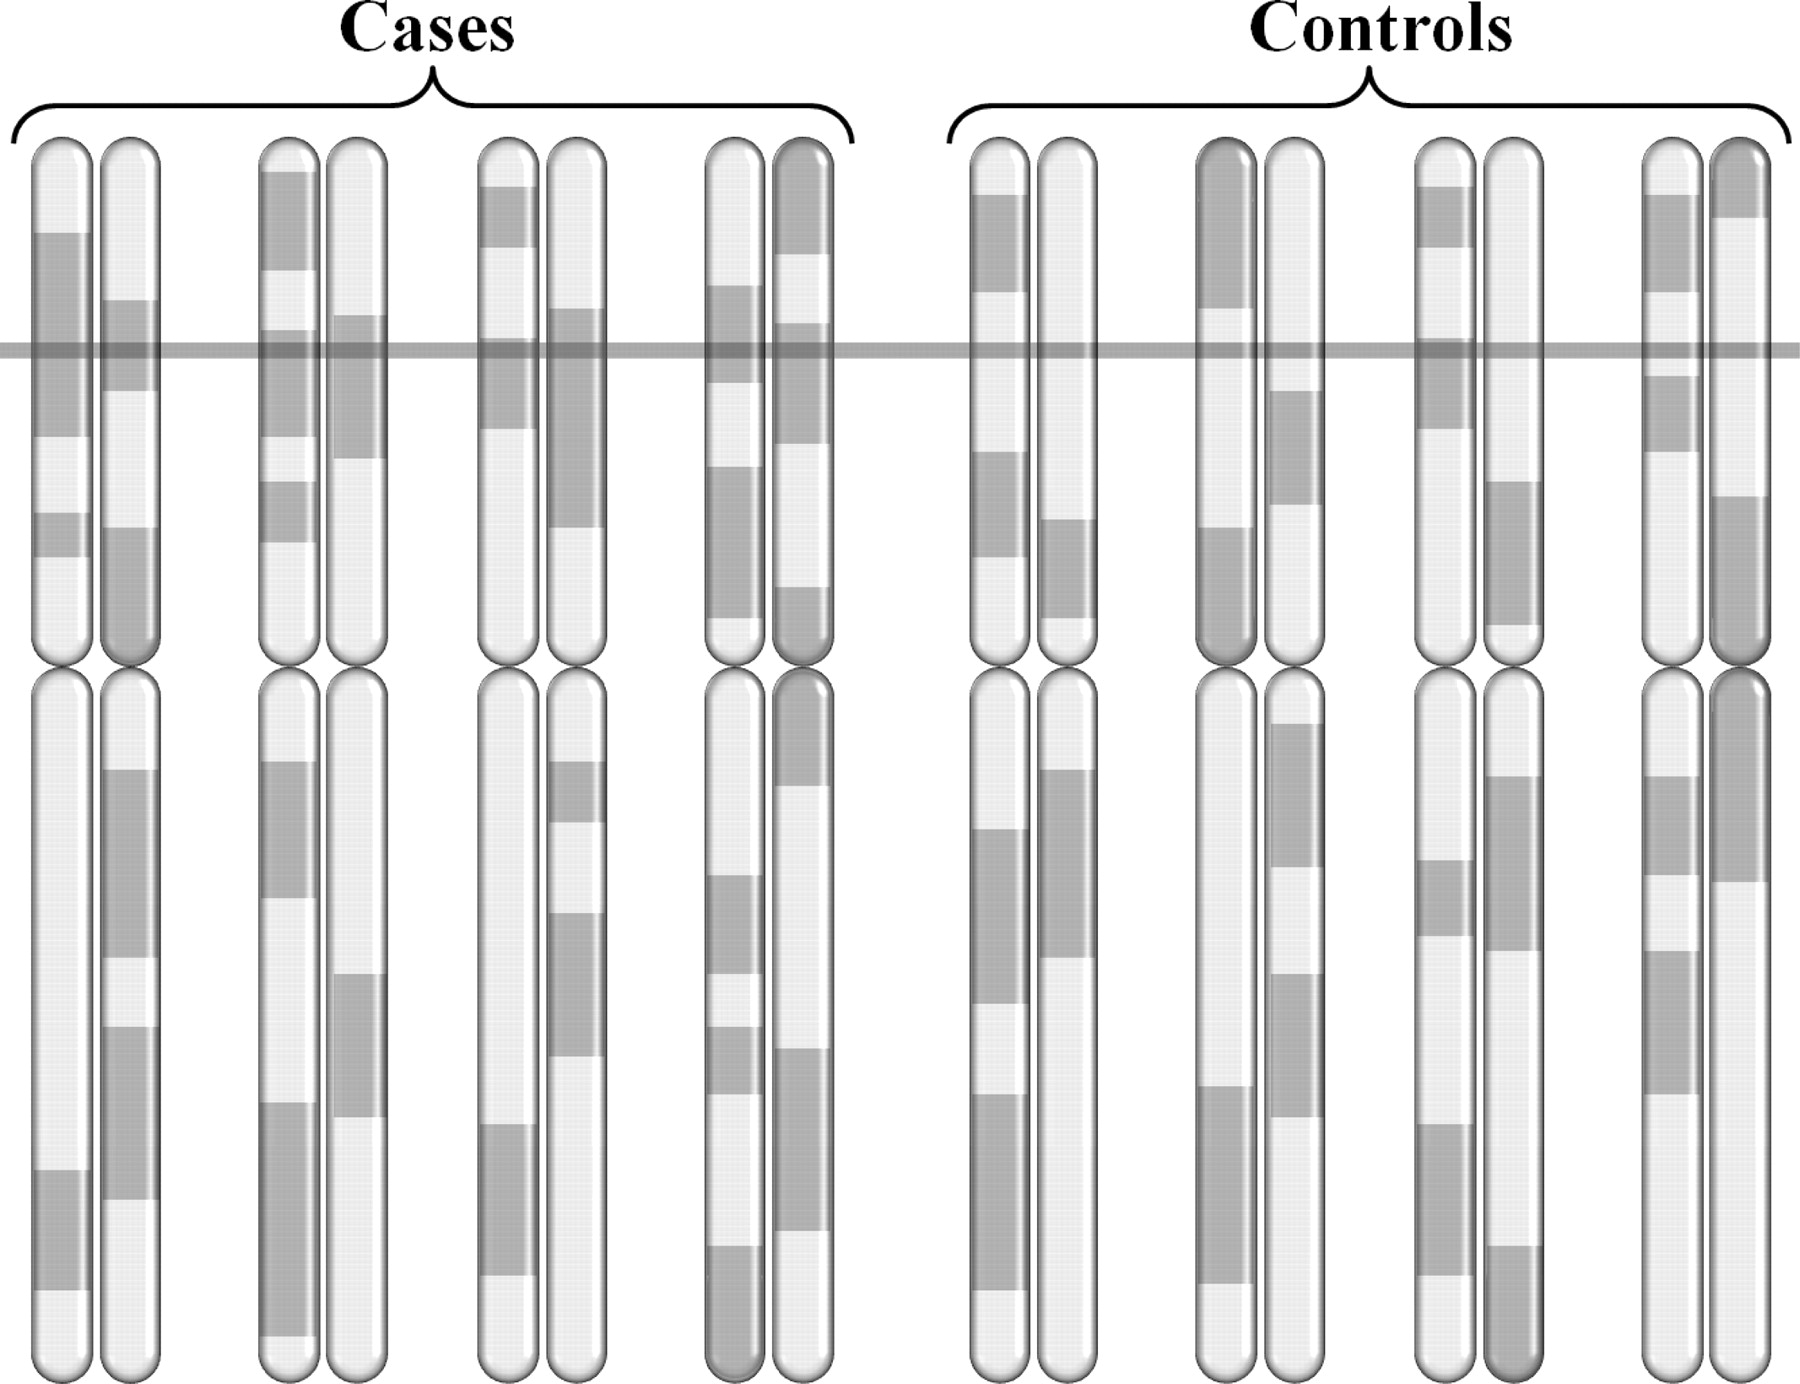
Figure 1.
Ancestry informative markers are used to compute the ancestry across the chromosomes of cases and controls. The region indicated by the bar shows elevated frequency of the higher risk ancestral population in the cases versus the expected distribution of ancestry in the controls, suggesting a disease susceptibility locus.