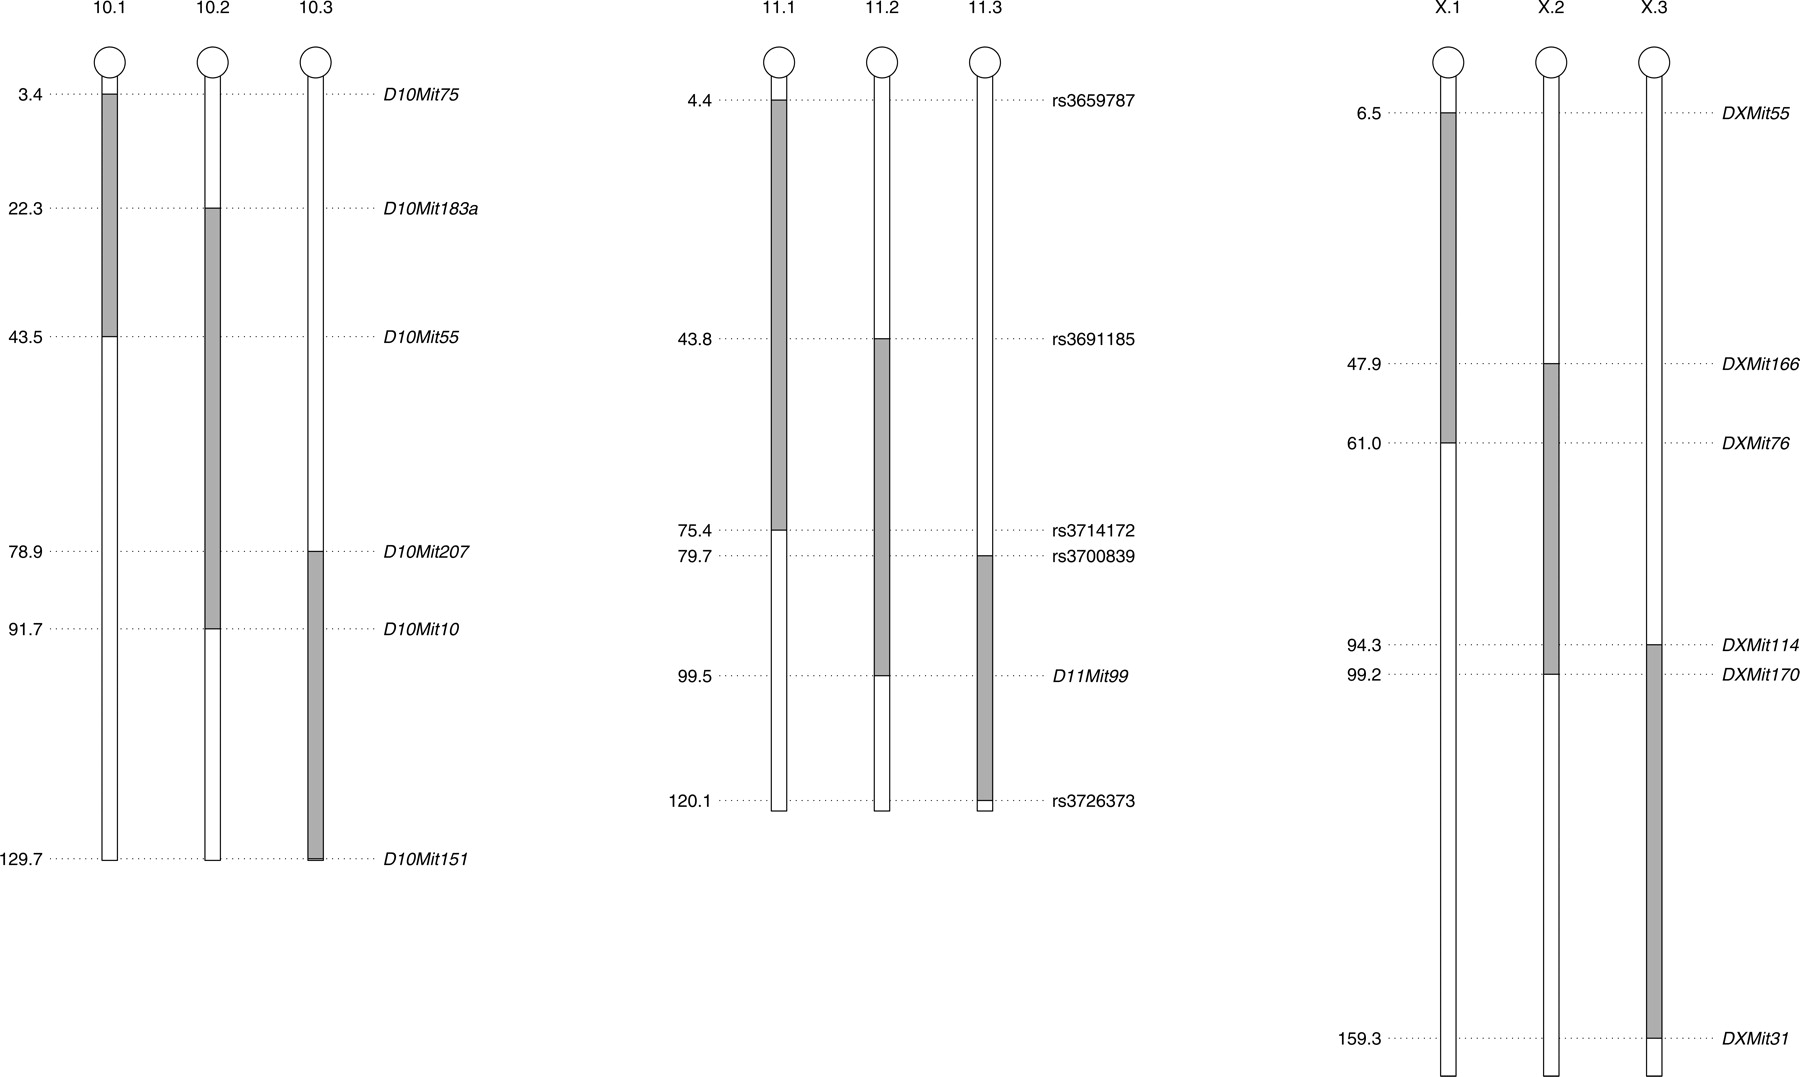
Figure 1.
Scheme of introgressed regions in subconsomic strains. The borders of PWD intervals (gray) were mapped to the closest neighboring single nucleotide polymorphism (SNP) or SSLP. Megabase scale.
Scheme of introgressed regions in subconsomic strains. The borders of PWD intervals (gray) were mapped to the closest neighboring single nucleotide polymorphism (SNP) or SSLP. Megabase scale.