Figure 1.
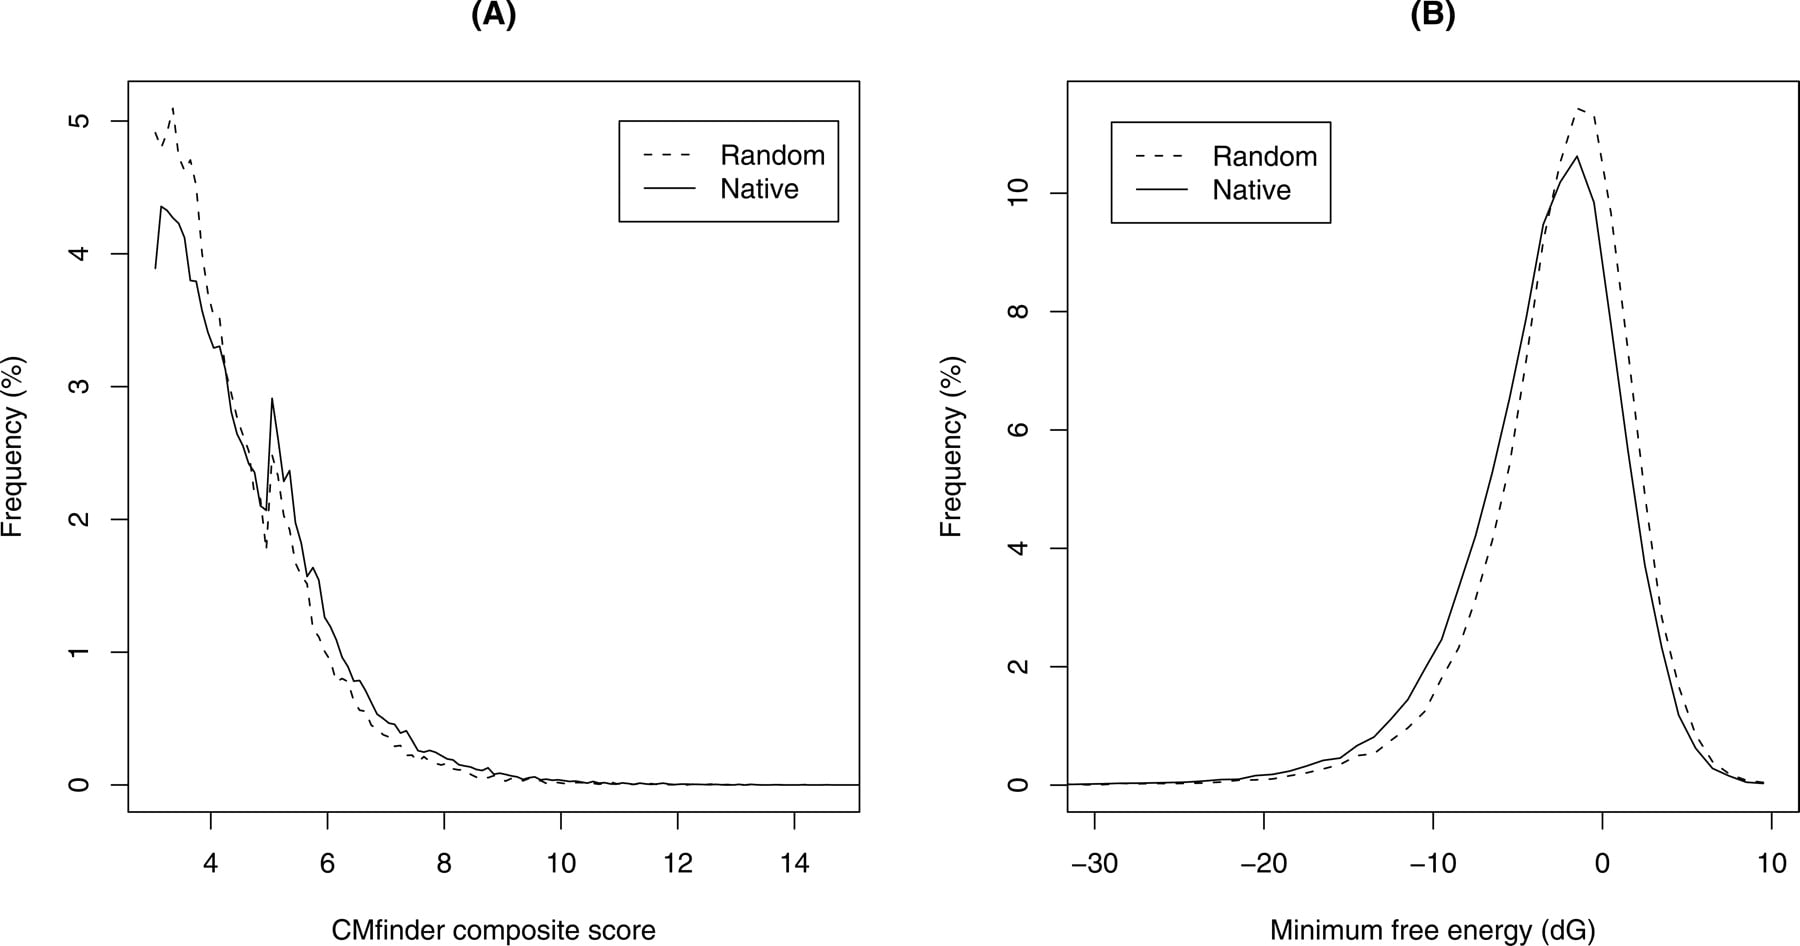
Score distribution of the full CMfinder input set (A) composite score and (B) consensus minimum free energies for the native and random (shuffled) sequences. There is a slight shift toward lower energy and higher score for our native data.
Score distribution of the full CMfinder input set (A) composite score and (B) consensus minimum free energies for the native and random (shuffled) sequences. There is a slight shift toward lower energy and higher score for our native data.