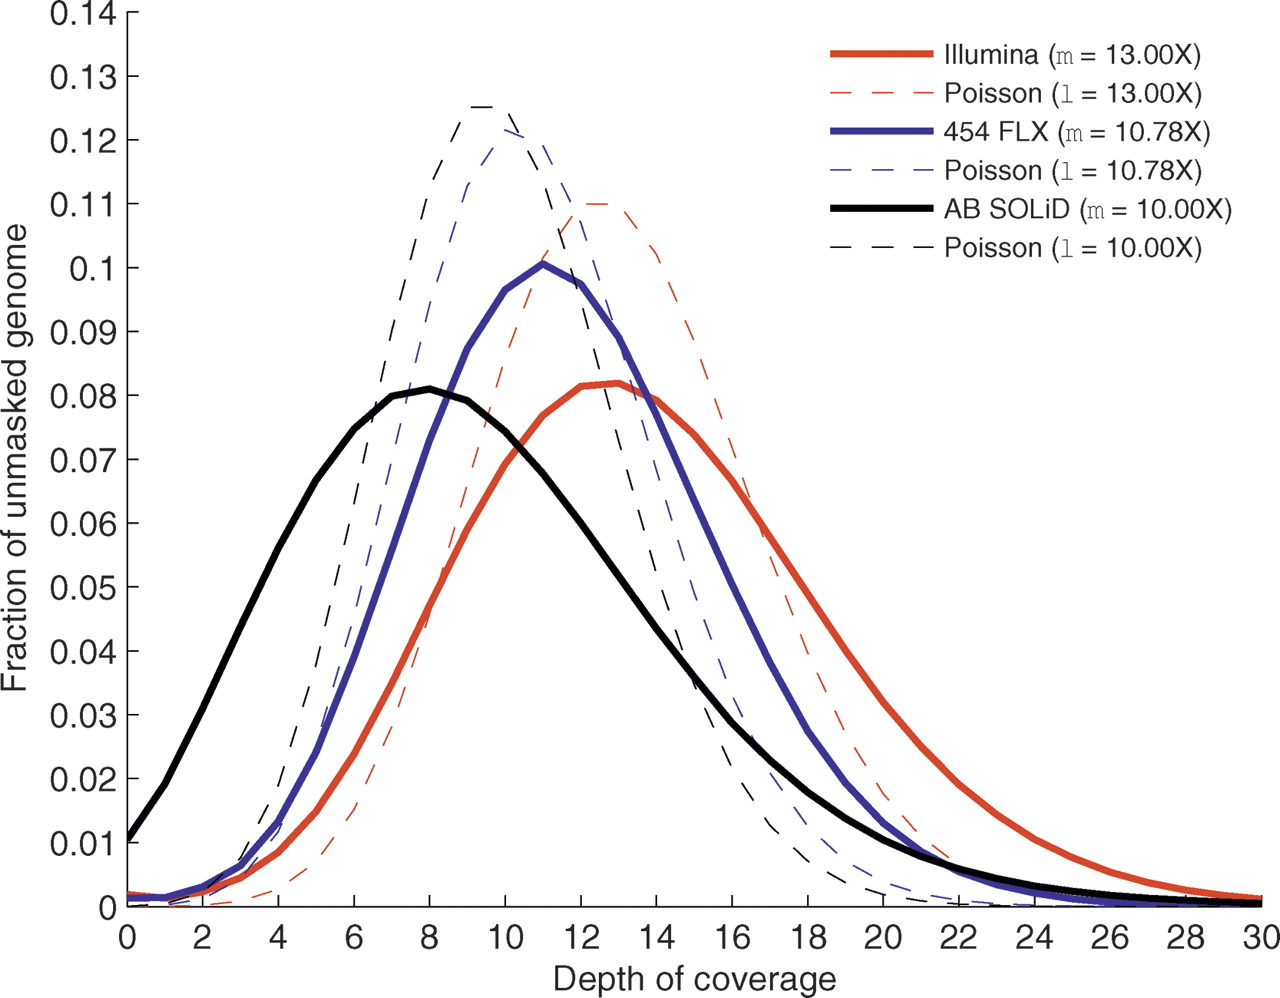
Figure 1.
Distribution of genome sequence coverage. The distribution of sequence coverage across the unmasked portion of the genome is shown for each technology. Here we represent comparable mean coverage levels for Illumina (red line, 13.00× mean genome coverage), 454 FLX (blue line, 10.78× mean genome coverage), and Applied Biosystems SOLiD (black line, 10.00× mean genome coverage) technologies. For each, we compare the observed coverage distribution to the expected Poisson coverage distribution (dotted lines of the same color for each technology).