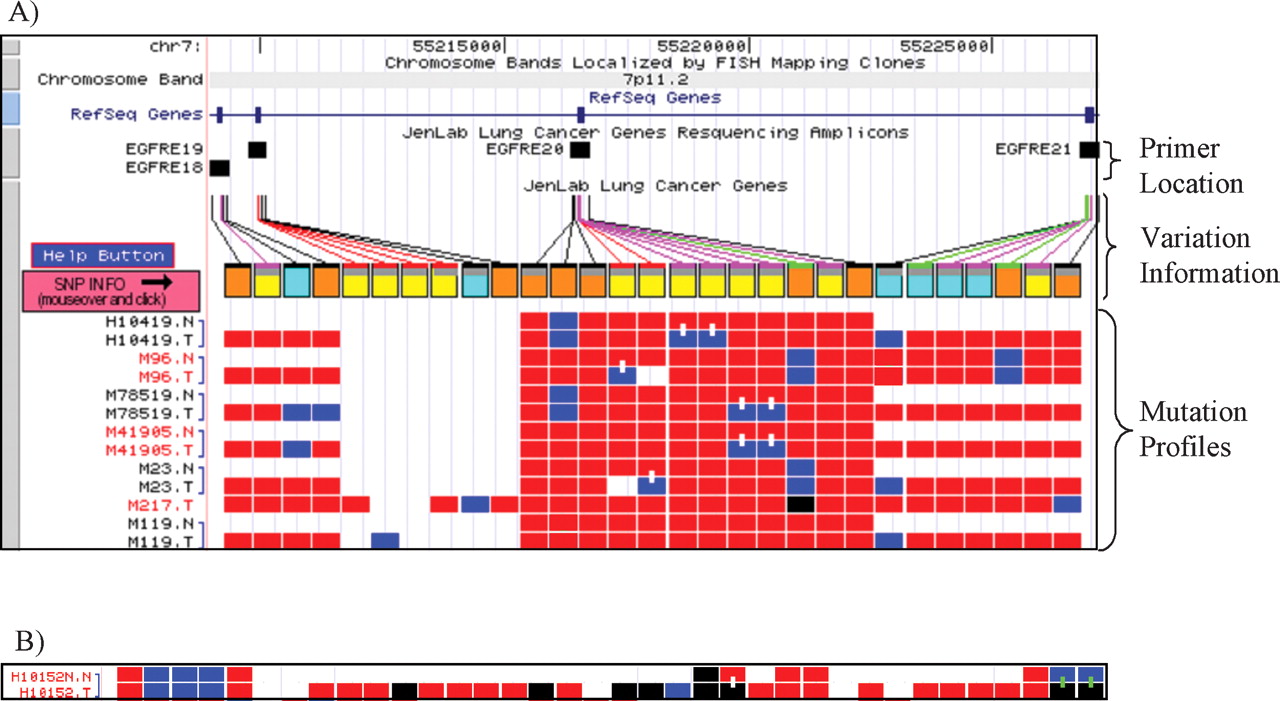
(A) Mutation profiles of EGFR exon 18–21 presented in the Cancer Genome Browser. The complete legend can be found by clicking “Help Button.” In this view, the genomic locations of the primers for each exon are displayed at the top. The variation information is shown in the middle. The color of the line connecting the genomic location of a variation to the genotypes indicates whether a genetic change is silent (green), missense (magenta), in-frame indel (red), or intronic (black). The same color was applied on the first layer of the information block. A variation with a gray bar in the second layer represents a novel genetic change not found in dbSNP. The color in the remaining portion of the block indicates whether a variation is somatic (yellow), germline (orange), or found only in tumor samples with no matching normal samples (cyan). The genotypes of paired tumor–normal samples (labeled with extension .T and .N, respectively) are displayed below, representing homozygous major alleles (red boxes), homozygous minor alleles (blue boxes), heterozygous alleles (black boxes), or missing data (white boxes). Genotype difference in a paired tumor–normal sample is highlighted by a vertical line across the paired samples, representing somatic mutation (white) or allele loss (green). (B) The mutation profile of the paired normal–tumor sample of H10152 in STK11. There are two SNPs indicating allele loss (two green lines) and one somatic mutation (one white line) in this sample.