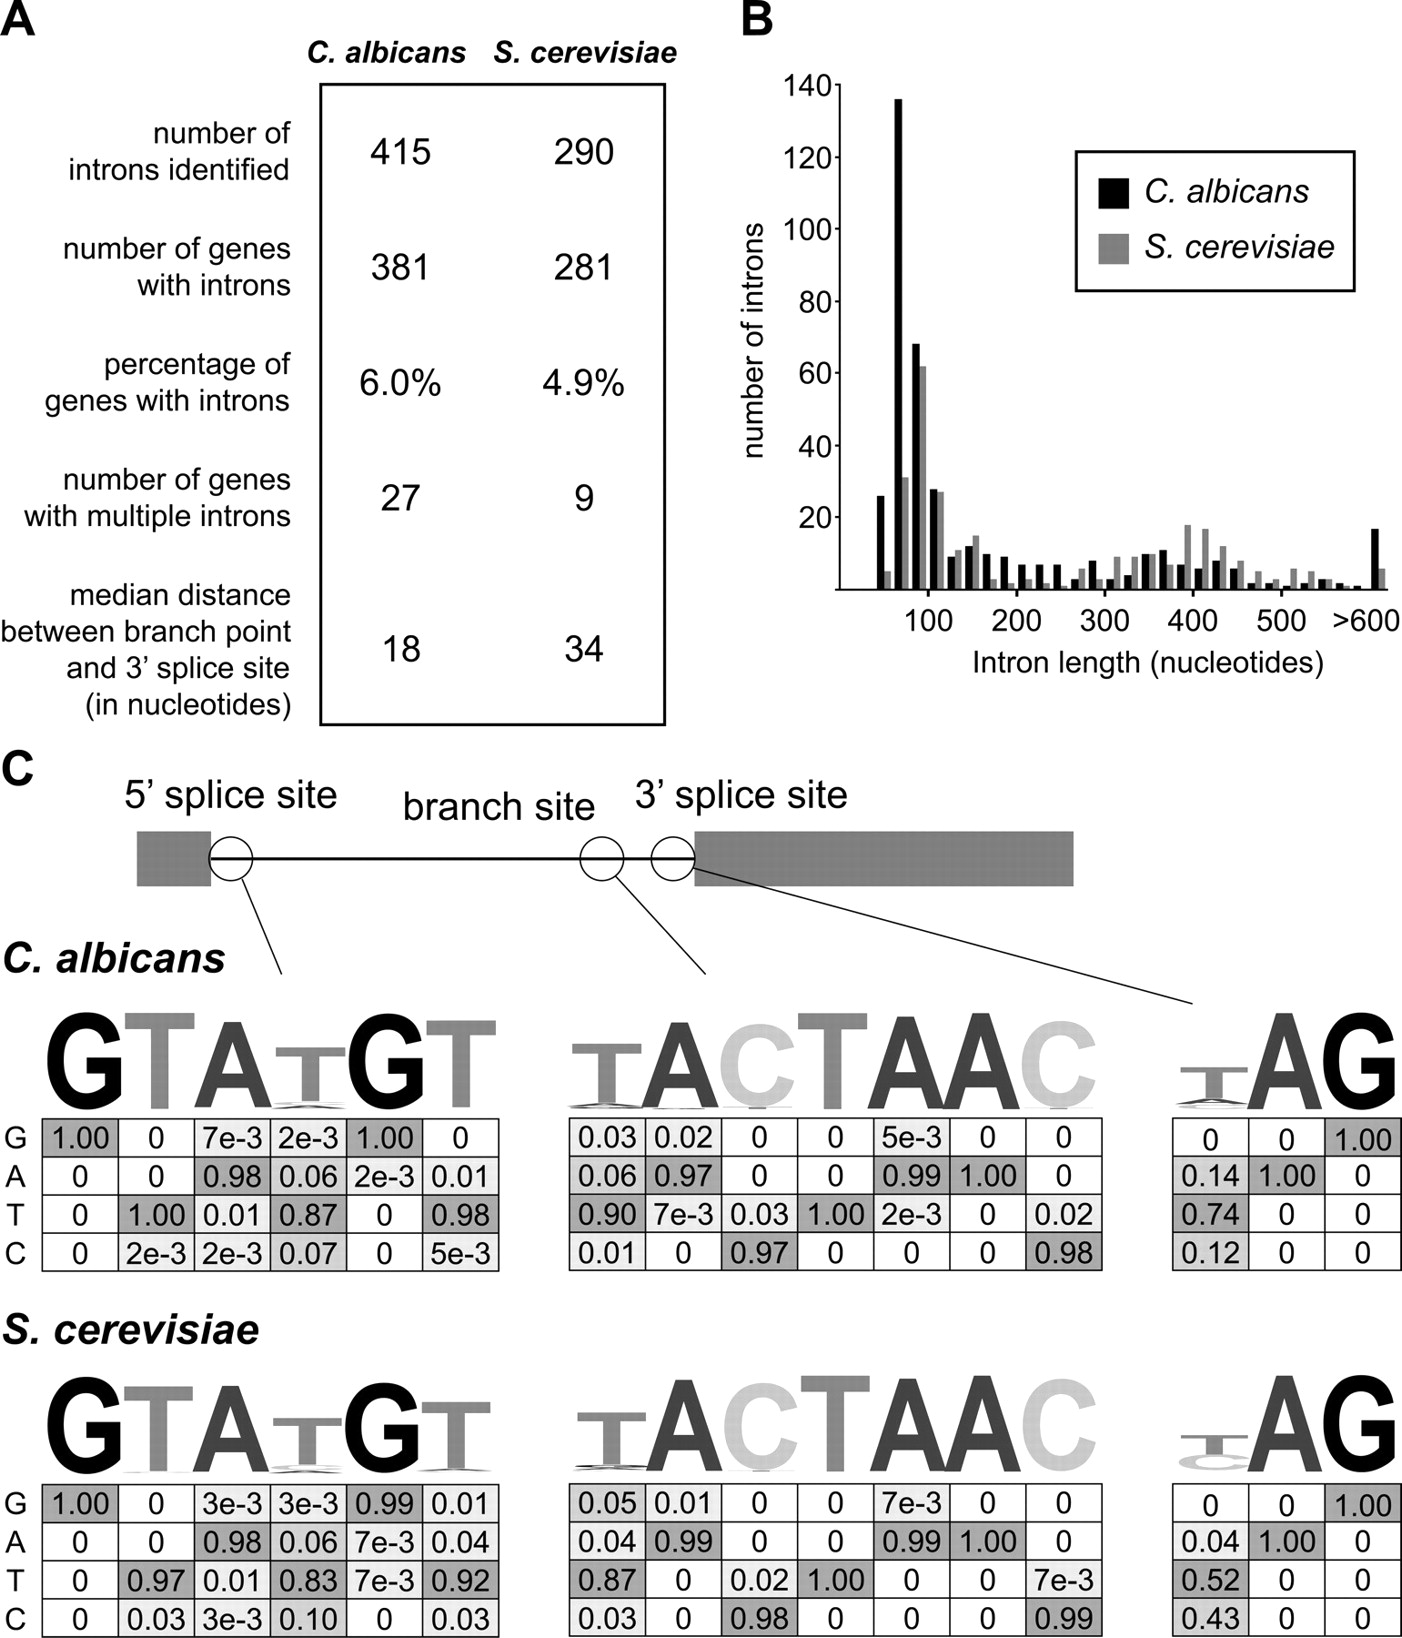
Intron comparisons between C. albicans and S. cerevisiae. For C. albicans, we used our high-confidence set of 415 introns. For S. cerevisiae, we compiled a set of 290 introns from various sources (http://www.yeastgenome.org, non-spliceosomal and five highly dubious introns removed; Ares lab yeast intron database at http://ribonode.ucsc.edu). (A) We derived intron statistics from the sequences in our sets directly. To compute the percentages of genes with introns, we used gene number estimates from Braun et al. (2005) and http://www.yeastgenome.org. (B) The distribution of intron lengths is shown as a histogram with a bin size of 20 nt. All introns longer than 600 nt are included in the final bin. (C) The nucleotide distributions within the 5′-splice sites, branch sites, and 3′-splice sites are shown as sequence logos (http://weblogo.berkeley.edu) and as numerical frequencies. Frequencies are shaded according to value, with higher frequencies shaded darker.