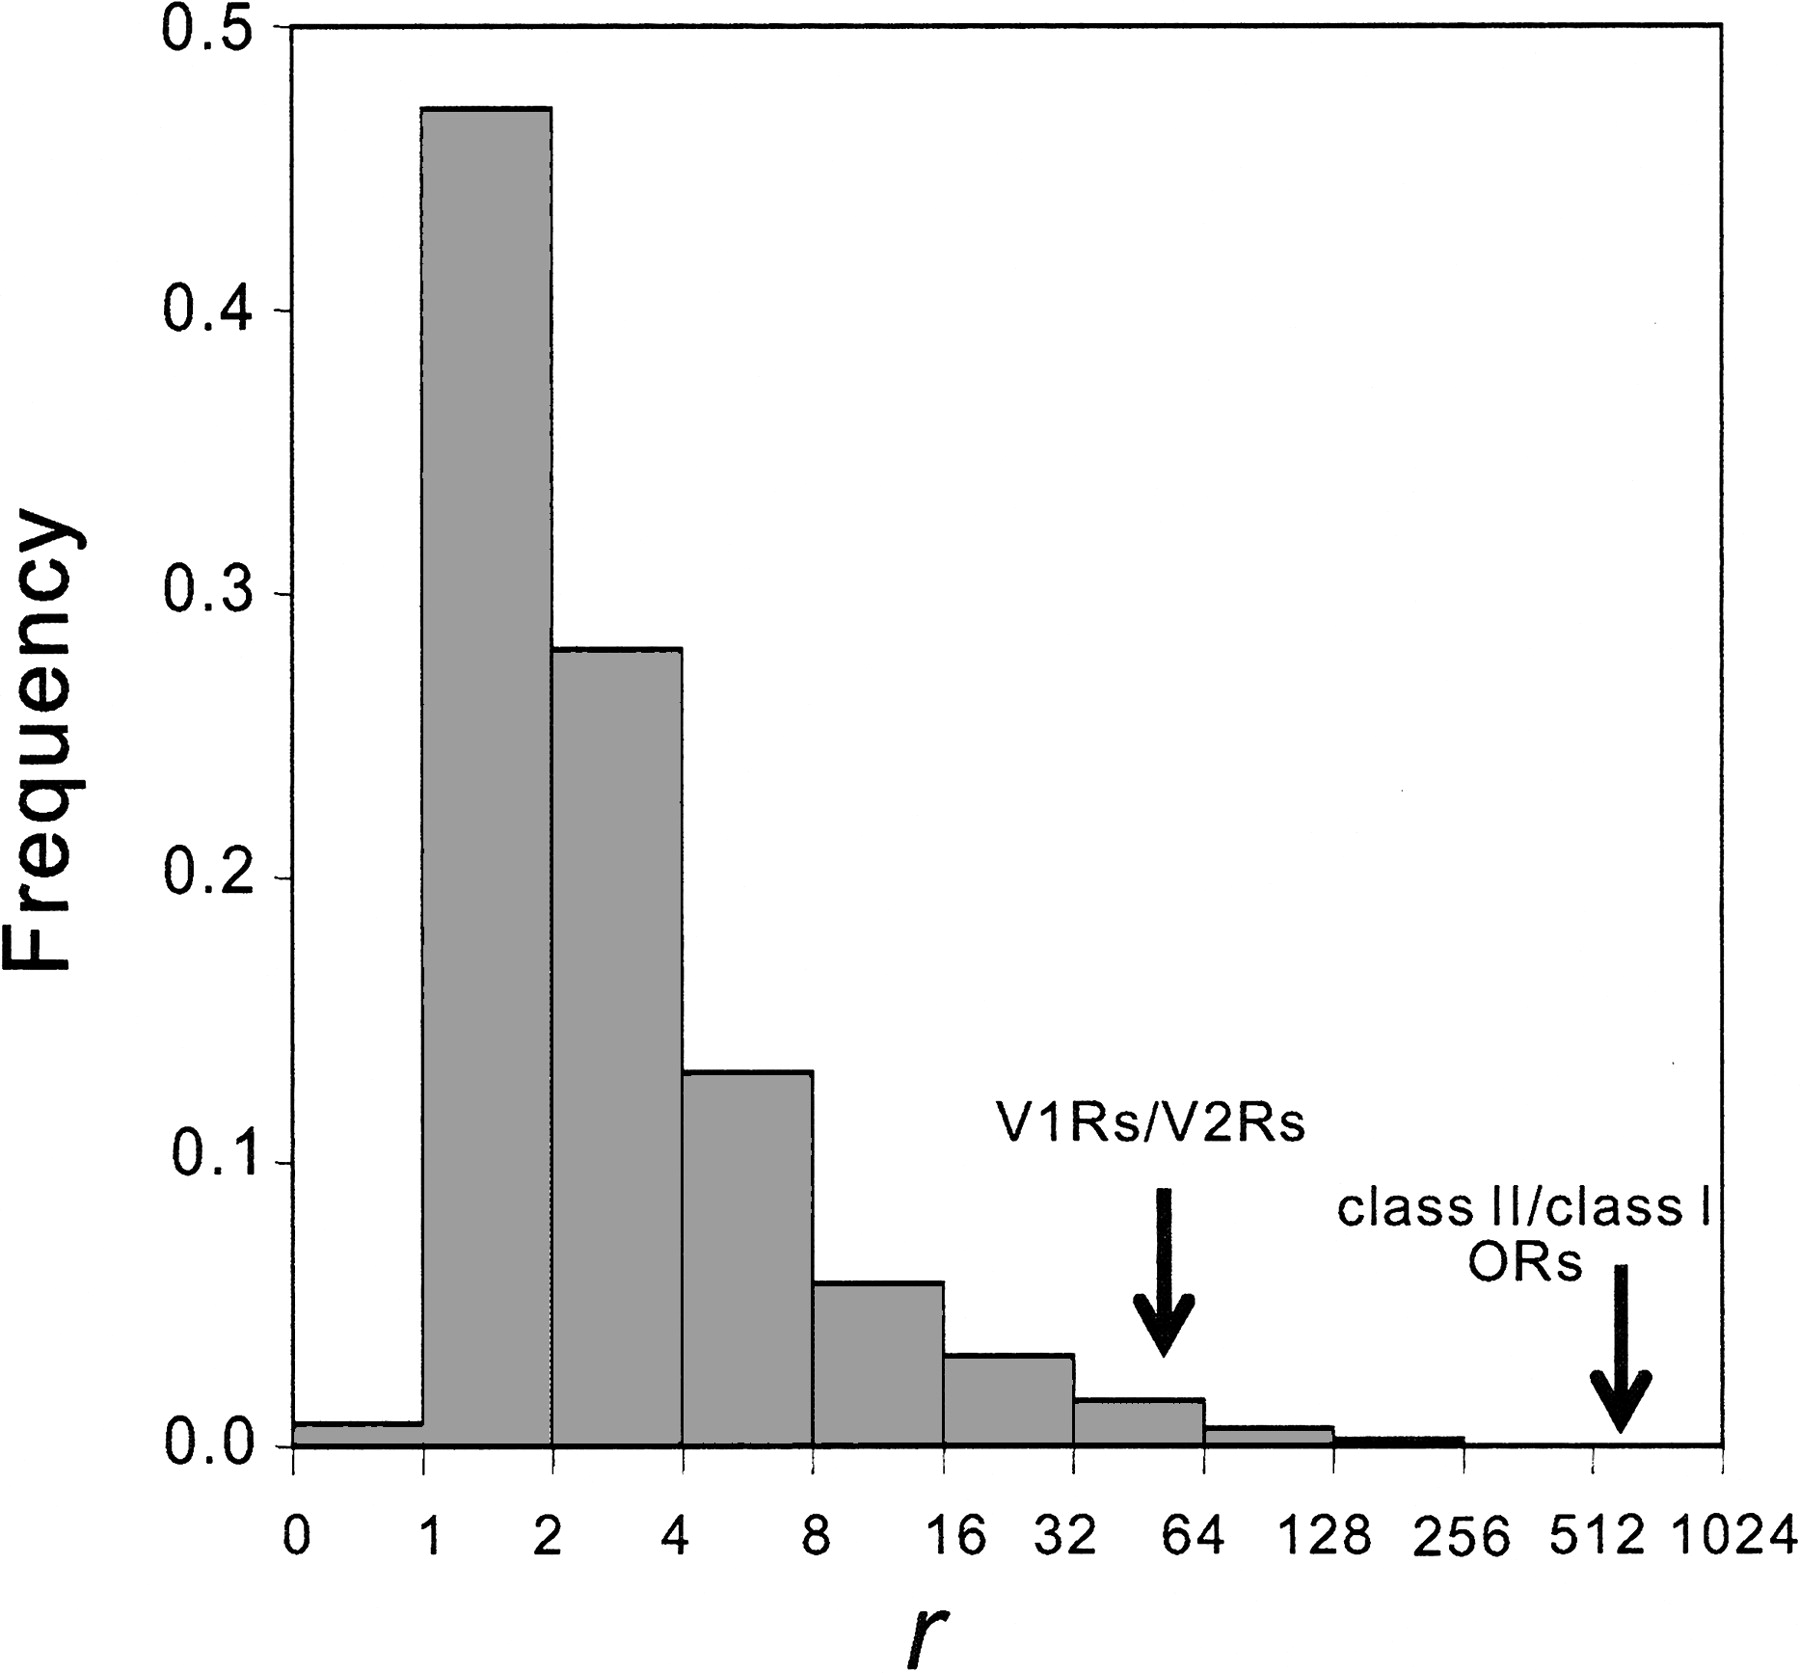
Figure 4.
Frequency distribution of the ratio (r) between mouse and zebrafish for the relative size of two randomly picked gene families from the genomes. More specifically, for gene families i and j, r = [nm(i)/nm(j)]/[nz(i)/nz(j)] when r ≥ 1, and r = [nz(i)/nz(j)]/[nm(i)/nm(j)] when r < 1. Here, nm(i) and nz(i) are the numbers of putatively functional genes in gene family i of the mouse and zebrafish, respectively. Arrows show the r value for V1Rs/V2Rs and that for class II/class I ORs.