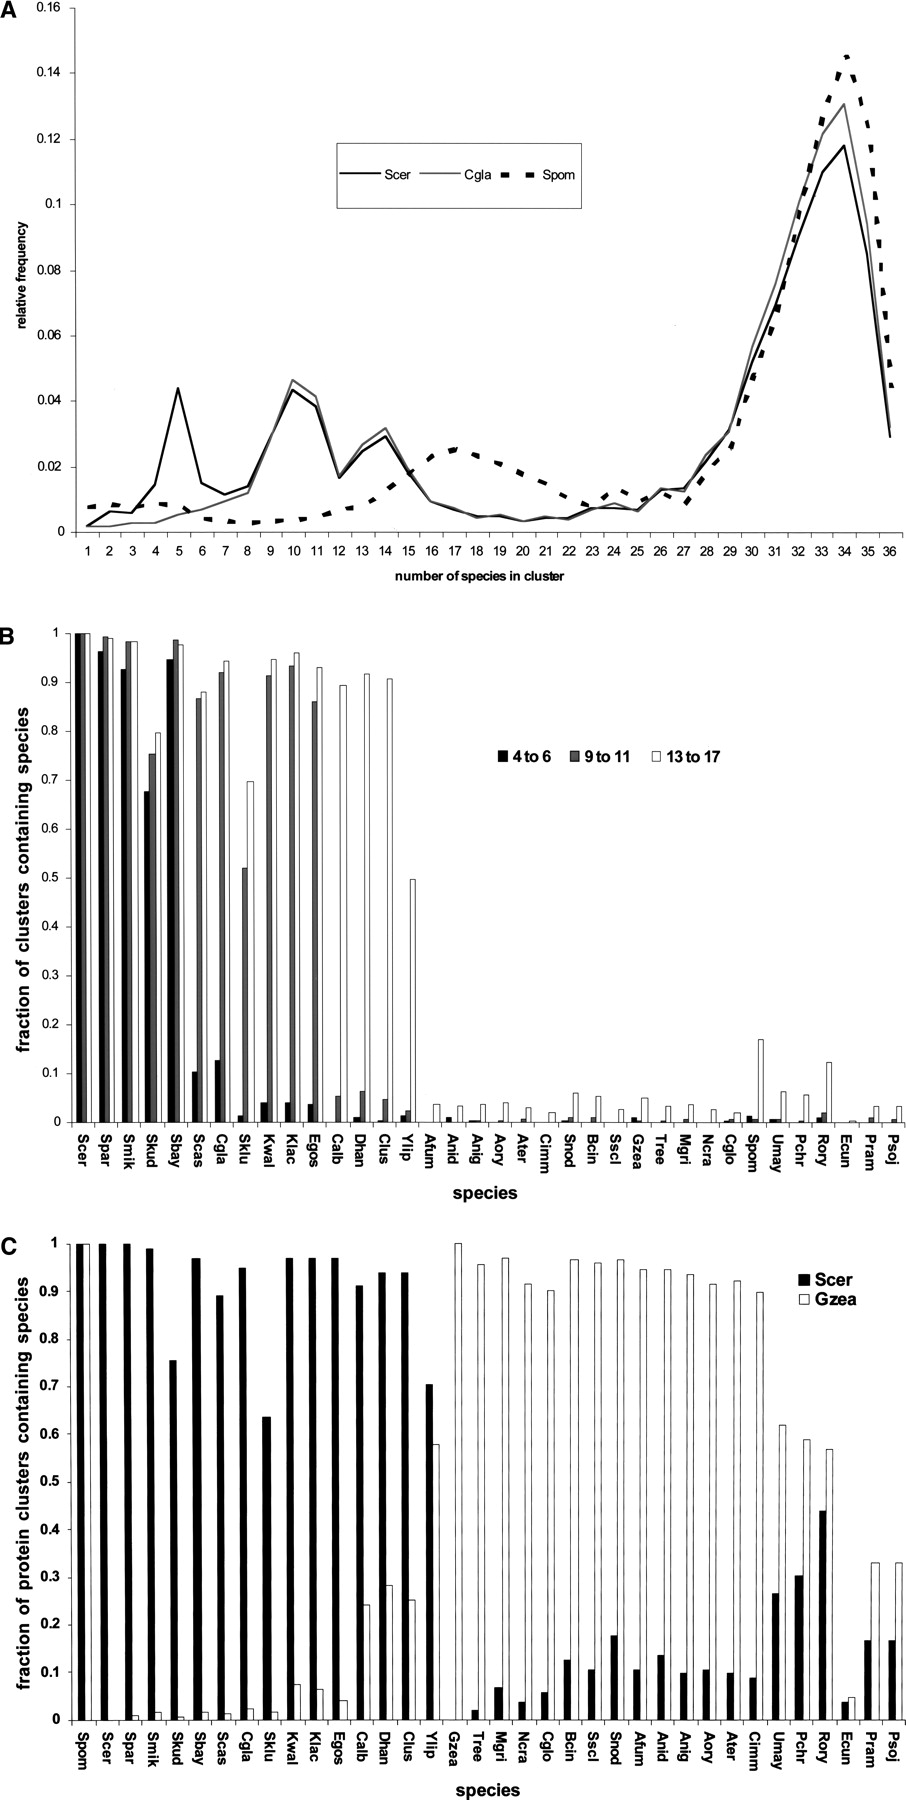
Figure 2.
Protein family conservation for fungal species. (A) The graph shows the relative frequency of numbers of species represented in clusters containing S. cerevisiae (black), C. glabrata (gray), and S. pombe (dashed). (B,C) The graphs show the fraction of protein clusters containing a representative from a fungal genome. Protein clusters are selected on the basis of the following criteria: (B) Protein clusters containing S. cerevisiae and a total of four to six genomes (black), nine to 11 genomes (gray), and 13 to17 genomes (white). (C) Protein clusters containing S. pombe and a total of 13 to 24 genomes including S. cerevisiae (black) and G. zeae (white).