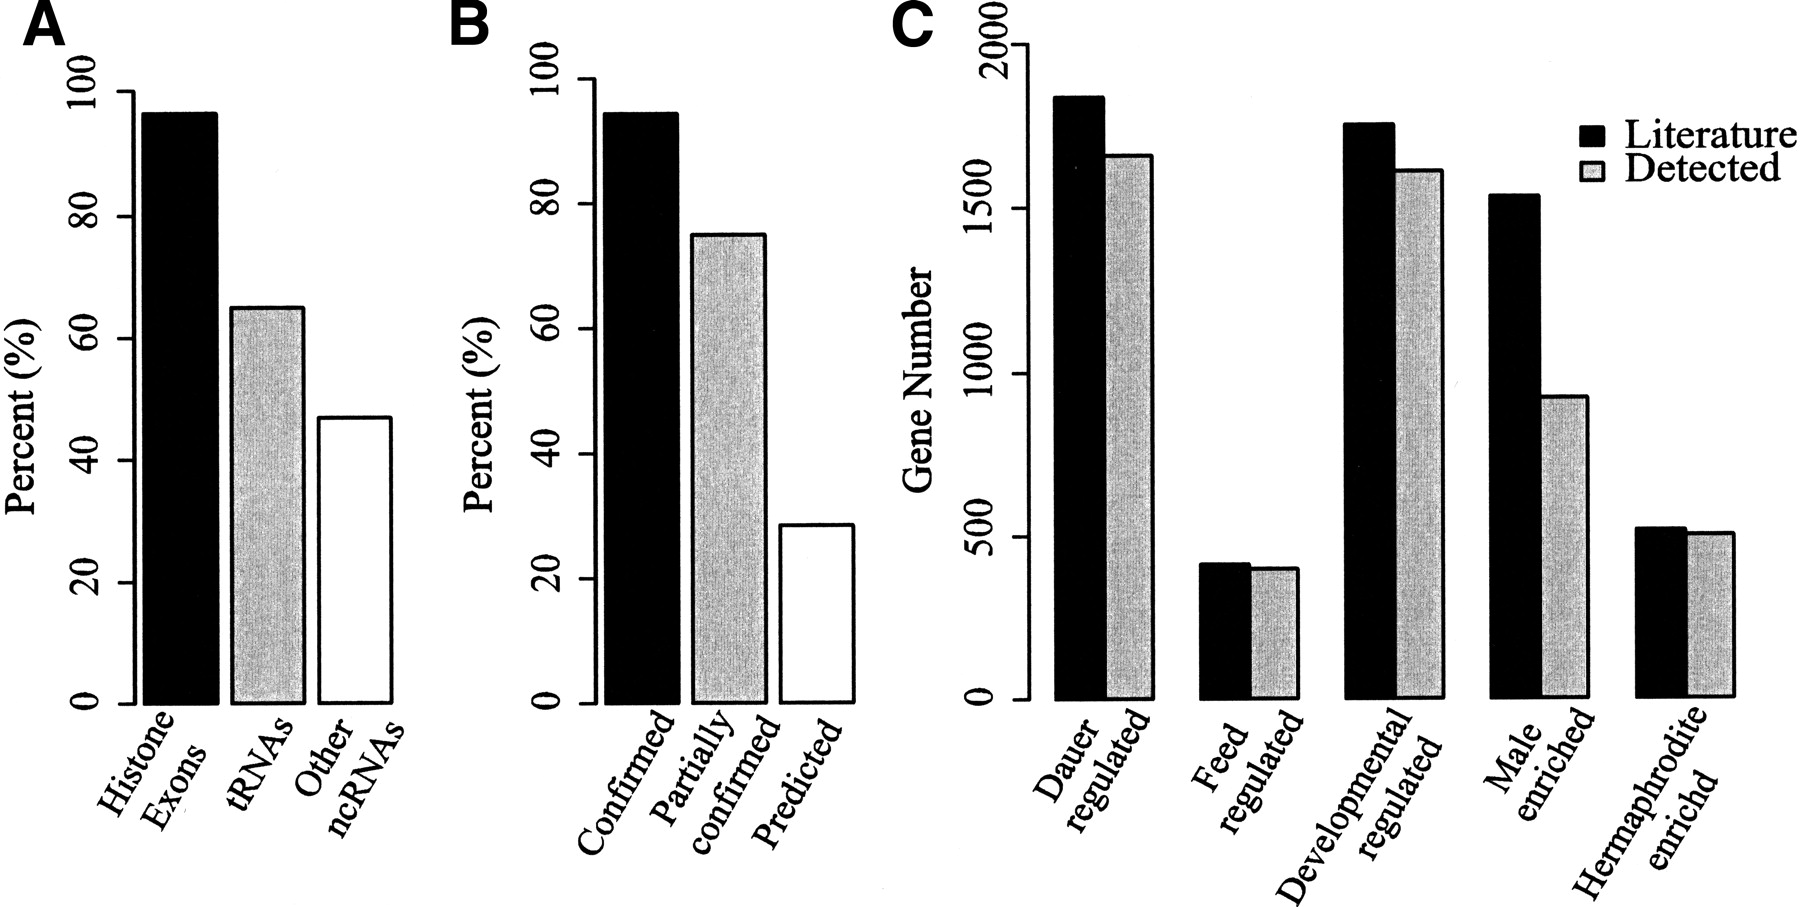
Figure 2.
Detection rates of annotated exons and genes in the NPA and PA samples. (A) Detection rates for histone exons, tRNAs, and other small ncRNAs in the NPA sample. (B) Detection rates for exons in genes with different confirmation status. Confirmed, partially confirmed, and predicted genes relate to genes in which all, some, or no exons, respectively, have experimental verification (WormBase; Chen et al. 2005). (C) Number of genes with literature-reported expression under various developmental and environmental conditions compared to number of the same genes detected in the PA sample on the tiling arrays.