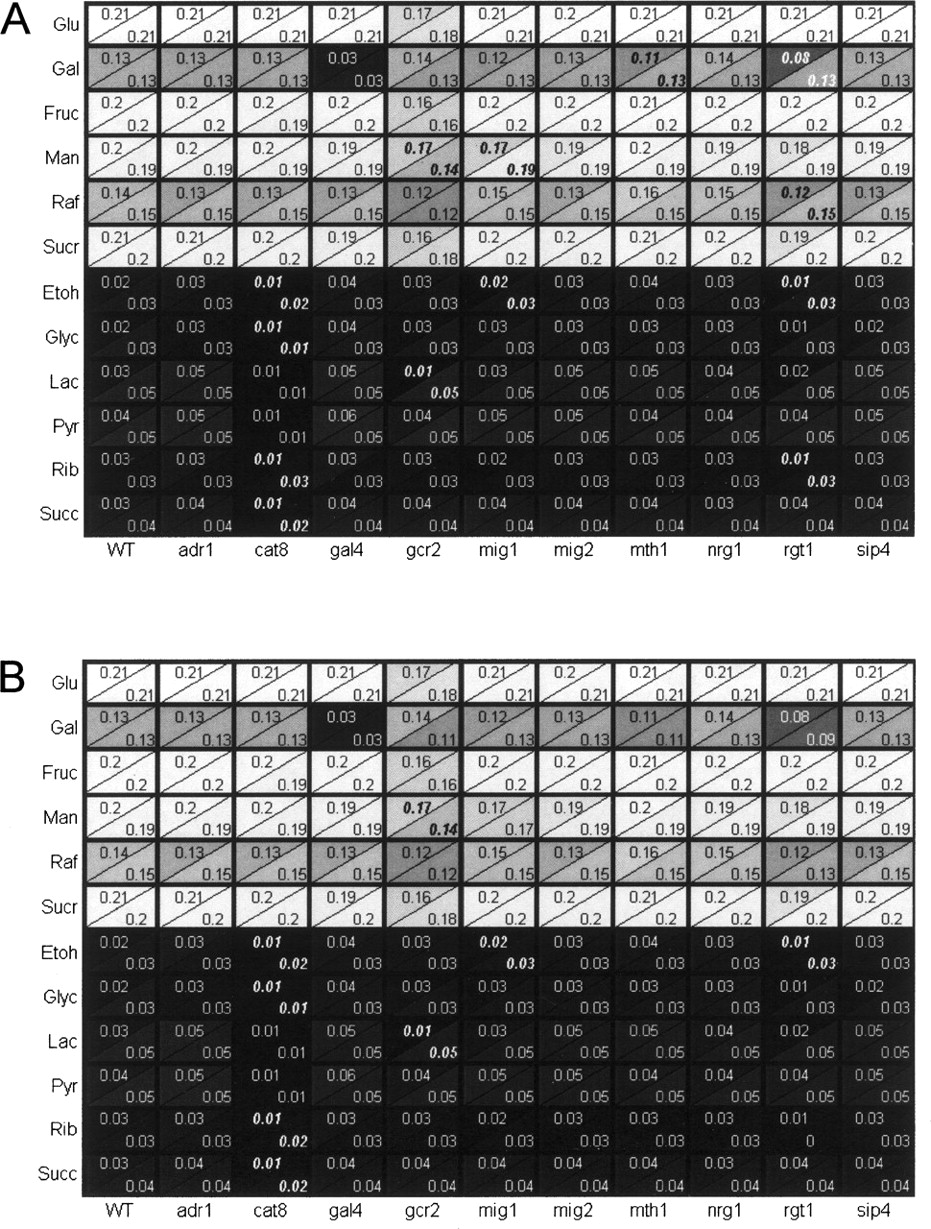
Figure 4.
(A) Measured (upper corner) and predicted (lower corner) maximum specific growth rates (1/h) for transcription factor deletion strains on different carbon sources. The in silico predictions were made using the iMH805/837 model. The color scheme indicates the magnitude of the growth rate from low (dark) to high (light). The squares with numbers in bold/italics indicate strain-condition combinations with significant mispredictions discussed in the Supplemental material. (B) Comparison of experimentally measured and predicted growth rates after the improvements to the model discussed in the Supplemental material were done.