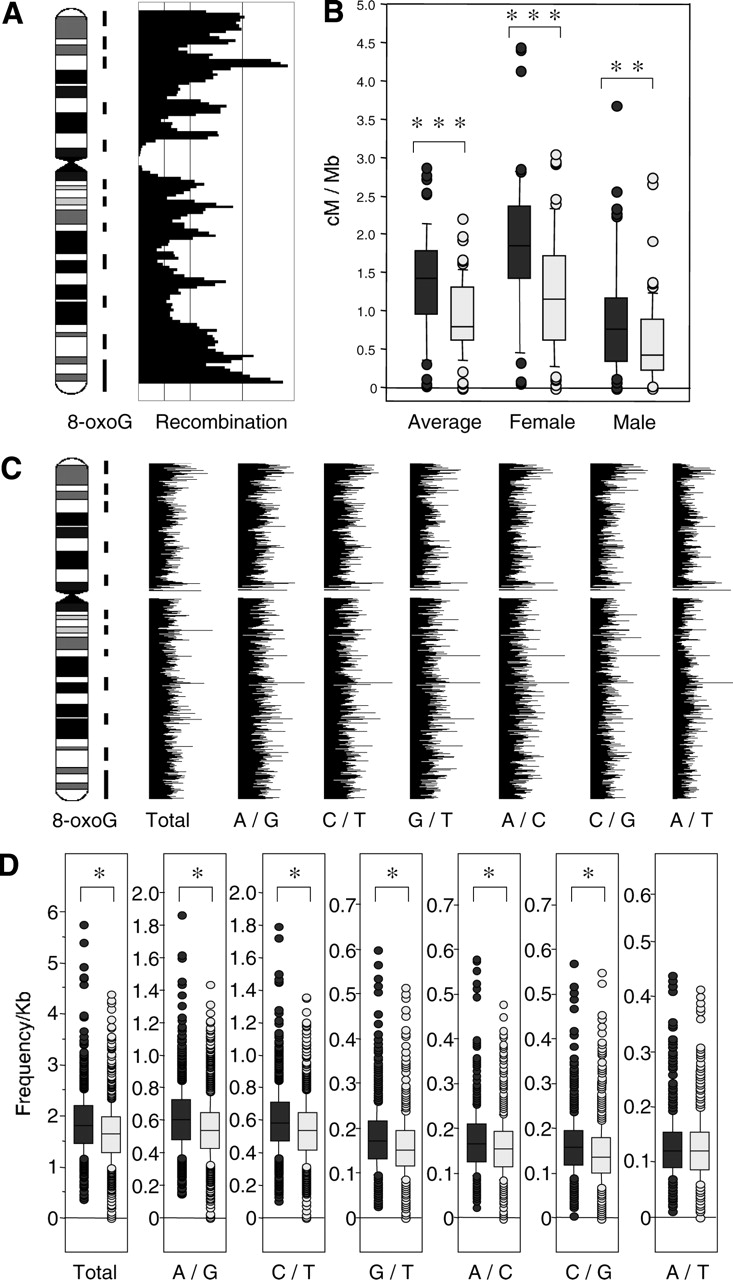
Comparison of 8-oxoG distribution on chromosome 11 and recombination rate or SNP frequency. (A) Regions with a high density of 8-oxoG are indicated by vertical lines on the right of the ideogram. The sex-averaged recombination rate (deCODE) was calculated with a 3-Mb window in 1-Mb steps and indicated as a bar plot with the chromosome lengths on the y-axis and recombination rates on the x-axis. (B) Box-whisker plot of recombination rates in chromosome 11 within regions with a high density of 8-oxoG (gray) and regions without a high density of 8-oxoG (light gray). (Mann-Whitney U-test, **P < 0.01, ***P < 0.0001). The center line within the box gives the median. The top and bottom boxes show the 75 and 25 percentiles, respectively. The top and bottom of the whisker show the 5 and 95 percentiles, respectively. (C) Bar plots of SNP frequencies. The SNP frequency for each base substitution was calculated with a 200-Kb window and in 50-Kb steps. The substitution spectra are indicated by two letters separated with a slash. For example, A/G means that A and G were recorded in a single position, and does not suggest the direction of the substitution. The regions with a high density of 8-oxoG are indicated by vertical lines on the right of the ideogram of chromosome 11. (D) Box-whisker plots of SNP frequencies in chromosome 11 regions with a high density of 8-oxoG (gray) and in regions without a high density of 8-oxoG (light gray) (Mann-Whitney U-test, *P < 0.05). Centrometic regions were excluded from the calculation.