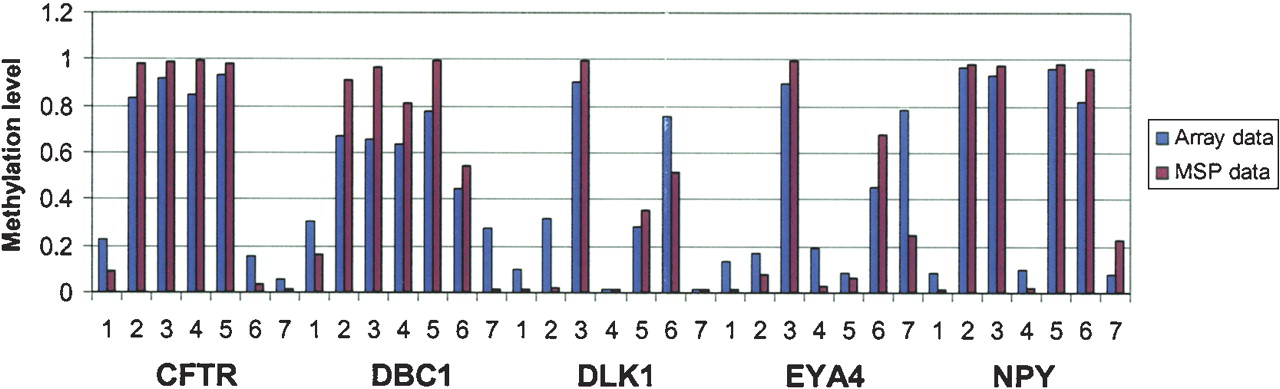
Figure 5.
Comparison of methylation-specific PCR and array-based methylation data. MSP was used to confirm the methylation status of CpG sites within the promoter regions of five genes that showed distinct methylation profiles in one normal lung tissue and six lung cancer cell lines from array-based methylation analysis (1: normal lung tissue; 2: NCI-H69; 3: NCI-H526; 4: NCI-H358; 5: NCI-H1299; 6: NCI-H1395; and 7: NCI-H2126). The methylation level is represented as bars, blue for microarray data and red for MSP data.