Figure 1.
Diagram of the (A) gene and (B) protein structures of csd drawn to scale. The figure is drawn based on Beye et al. (2003).
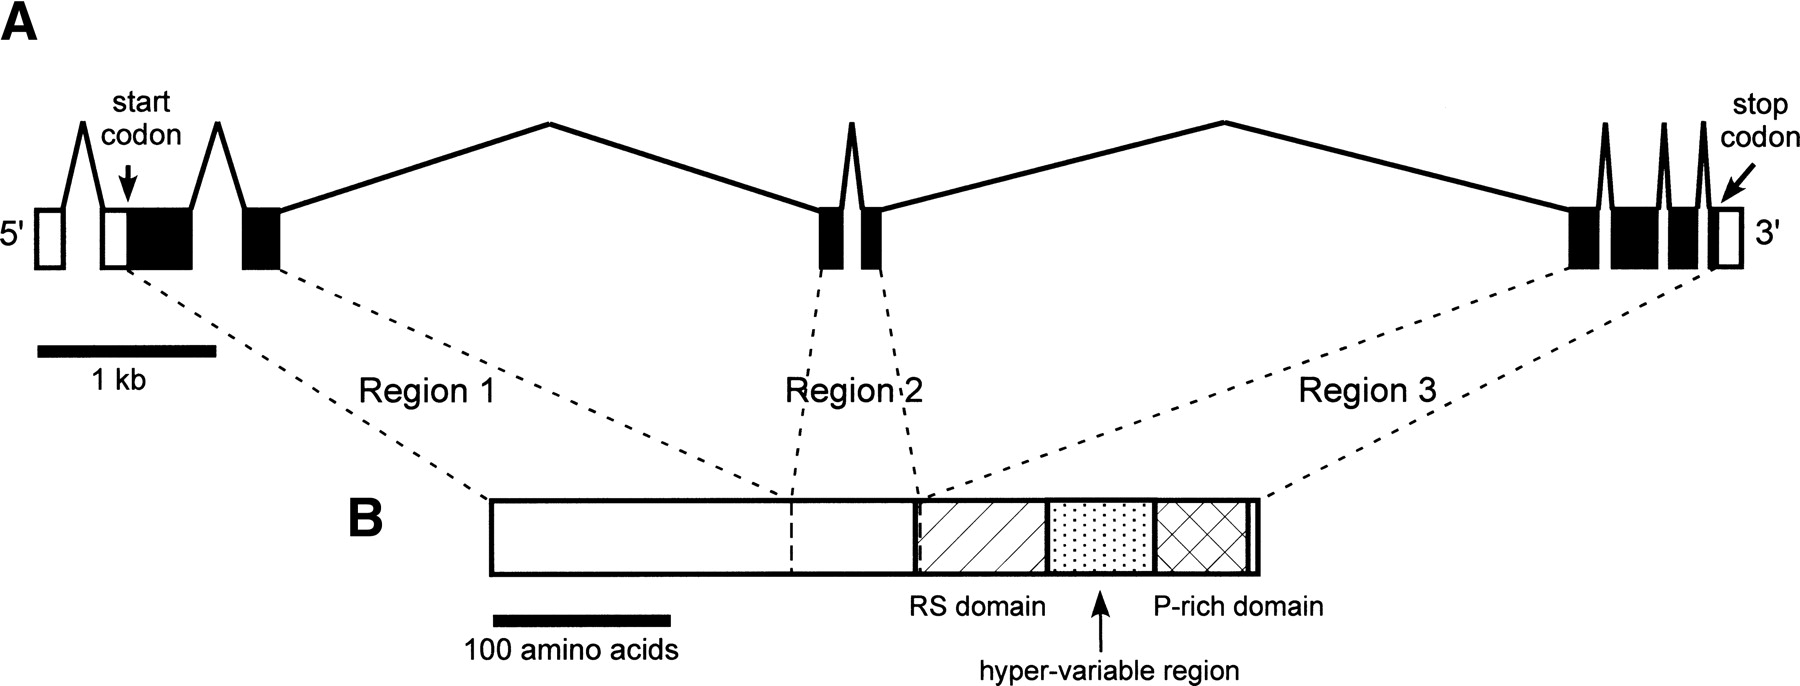
Diagram of the (A) gene and (B) protein structures of csd drawn to scale. The figure is drawn based on Beye et al. (2003).