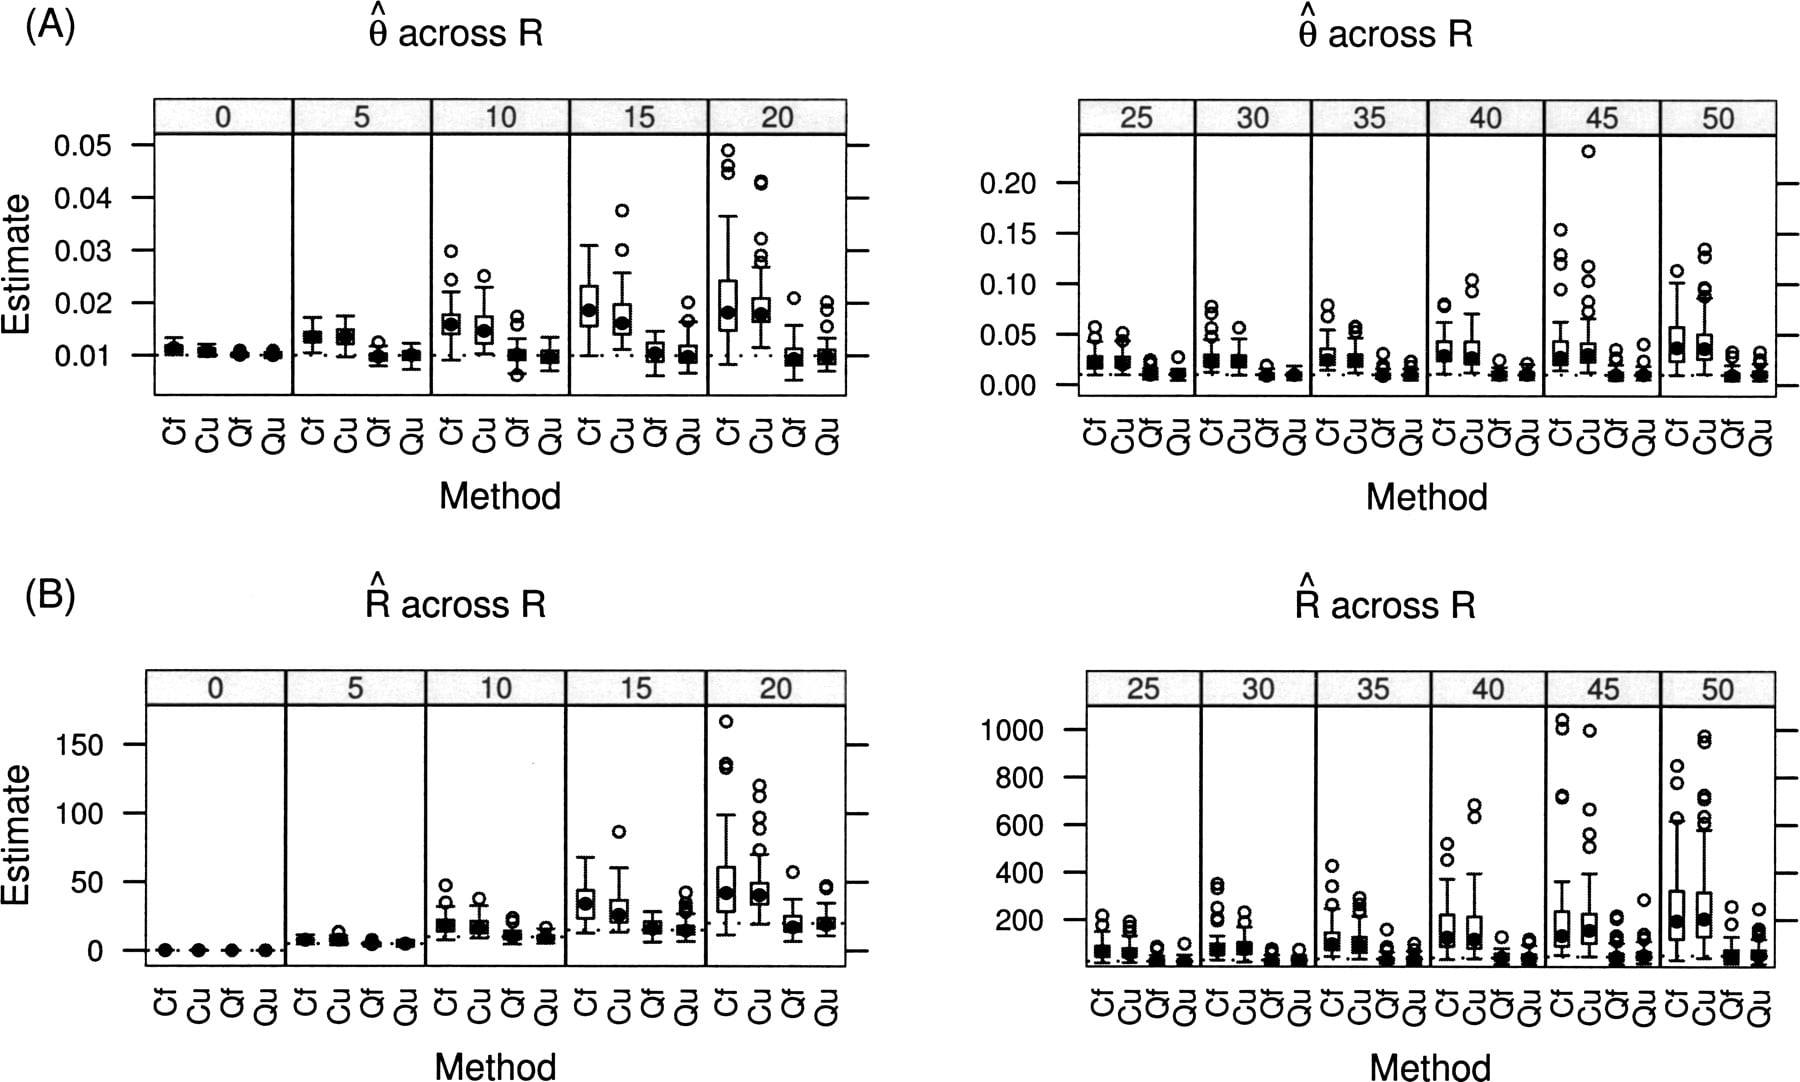
Figure 4.
Performance of the four techniques (Cf= Cutoff of 30 with folded spectrum, Cu = Cutoff with unfolded spectrum, Qf =Quality scores with folded spectrum, Qu = Quality with unfolded spectrum) across a range of true values of R (labeled at top) with θ = 0.01. (A) Estimated value for θ; (B) estimated value for R. True values for each parameter drawn as dotted lines. Box-and-whisker plots show quartiles and extreme values.