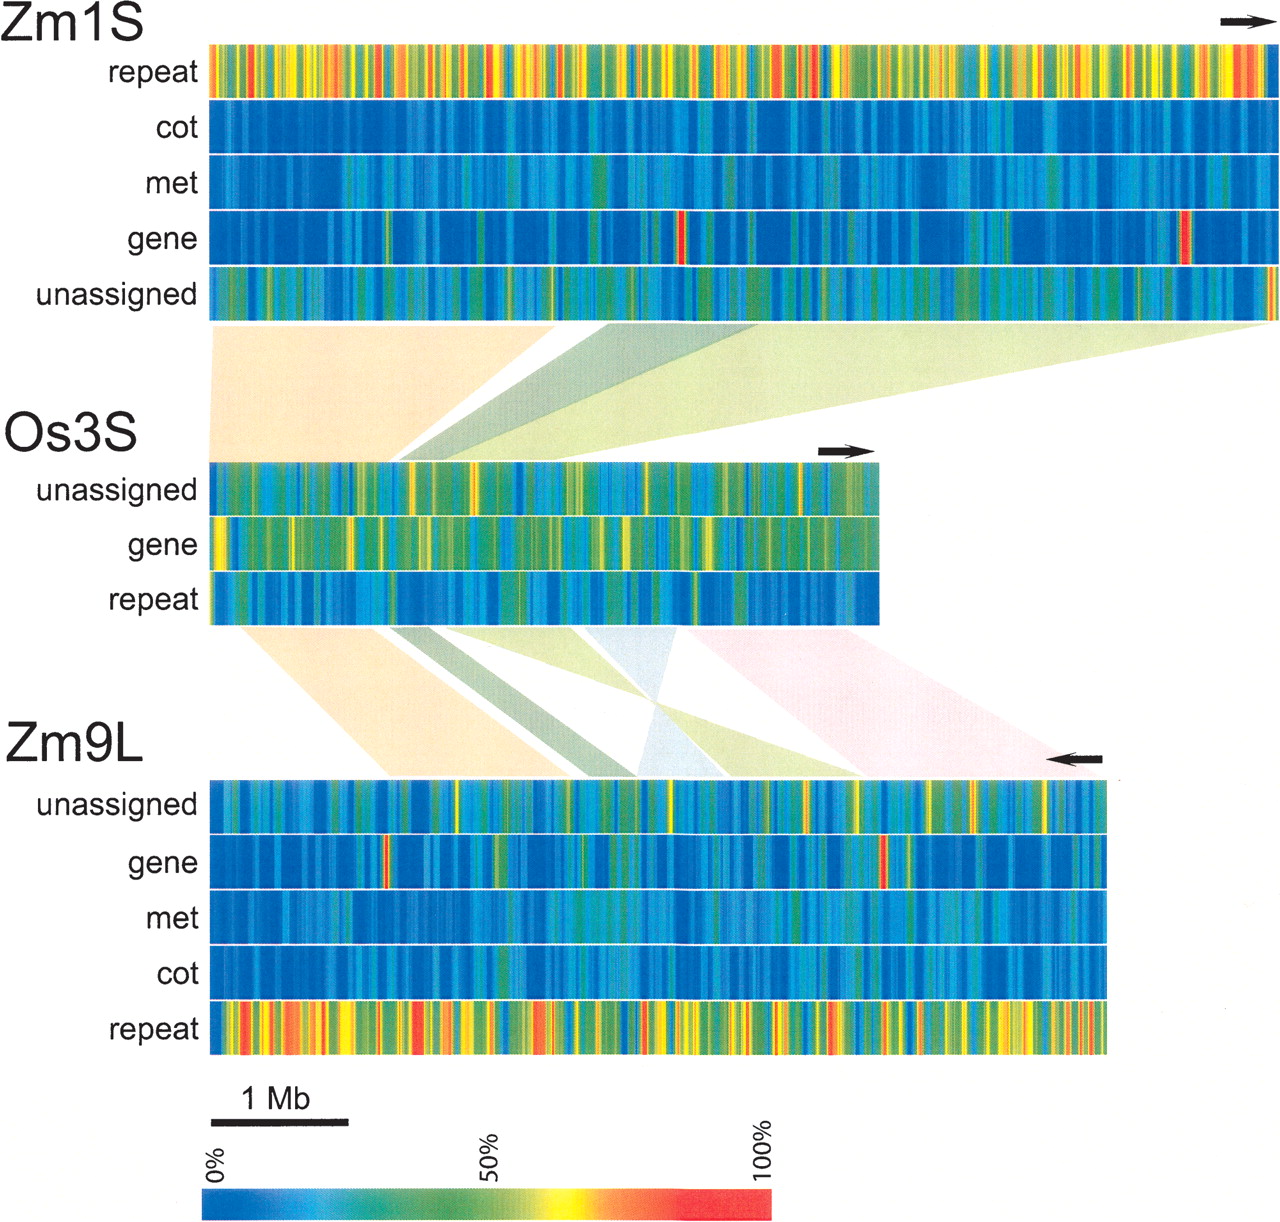
Figure 3.
Position and density of sequence features of the maize regions Zm1S and Zm9L, and rice chromosomal region Os3S. Color-coded densities of several genomic features (repeats, coverage by filtrated GSSs and genes) are shown for Zm1S, Zm9L, and Os3S. Blue represents lowest (0%), green medium (50%), and red highest (100%) density of the respective feature. Relative density has been determined within a sliding window of 50 kb and in steps of 1000 bp. Locations of GSSs represent alignment positions by BLASTN. Note that the four high-density regions within the maize gene bars indicate four very large genes (>50 kb gene size) that were predicted by our annotation.