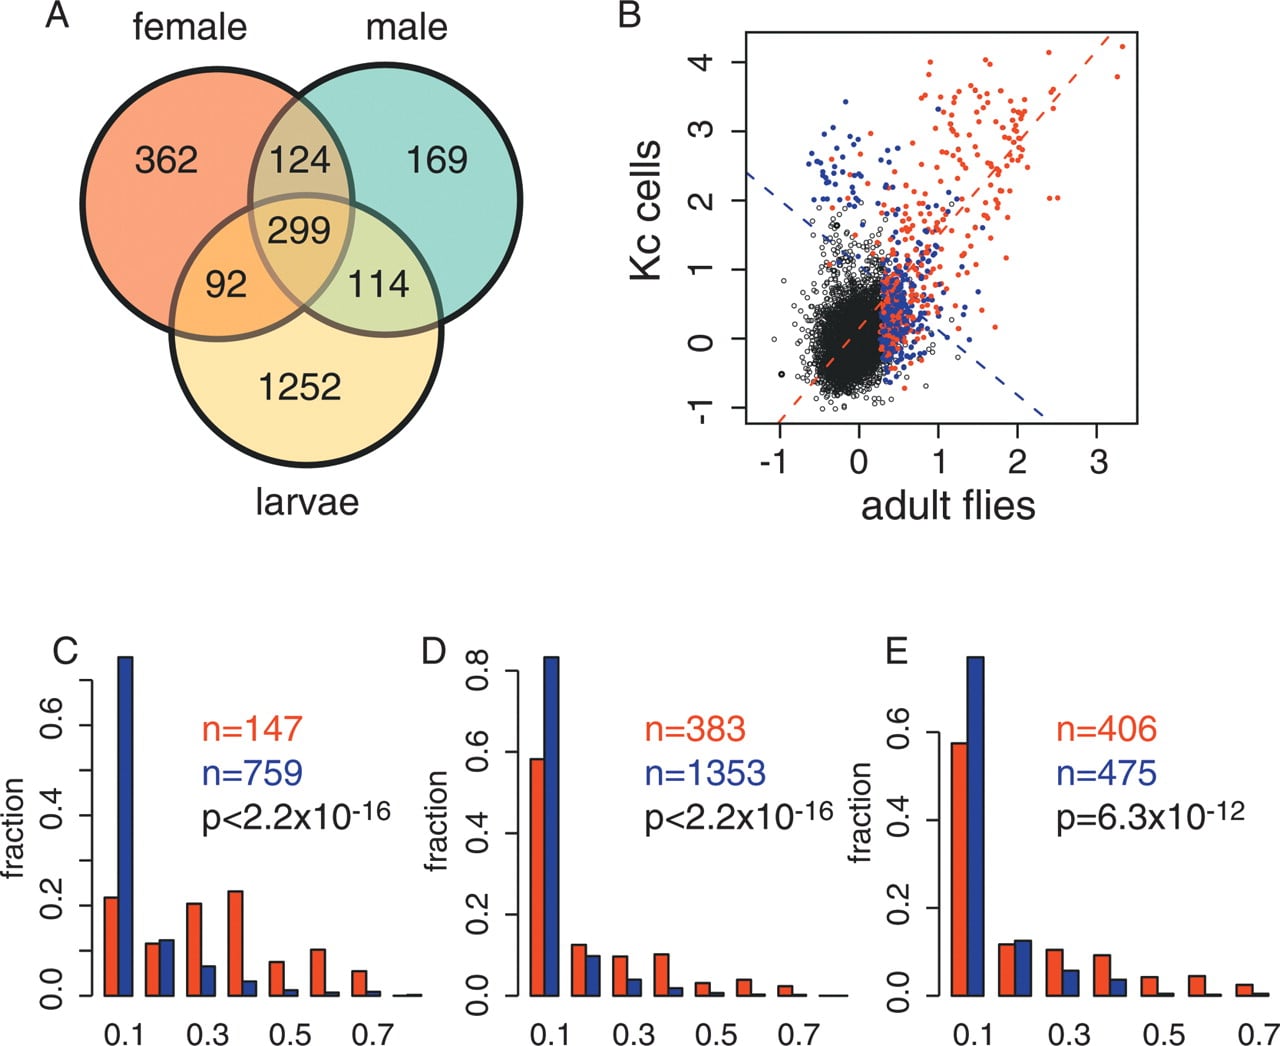
Repetitive regions are associated with developmentally stable HP1 binding. (A) Venn diagram showing the number of overlapping and non-overlapping HP1 target genes in adult males, adult females, and female larvae. (B) Scatterplot of the binding log2 ratios of HP1 in whole adult flies versus HP1 binding in Kc cells. Colored circles indicate targets of HP1 either in adult flies or in Kc cells or in both. Blue circles indicate cDNAs that have an FRI20kb < 0.05, red circles are cDNAs that have an FRI20kb > 0.05. The broken lines are the regression lines through the blue and red data points. (C) The distributions of the FRI20kb for the genes that are bound by HP1 in both Kc cells and male adult flies (red) and for the genes that are bound by HP1 in either Kc cells or male adult flies, but not in both (blue). (D) The distributions of the FRI20kb for the genes that are bound by HP1 in both female larvae and in male adult flies (red) and for the genes that are bound by HP1 in either female larvae or male adult flies (blue). (E) The distributions of the FRI20kb for the genes that are bound by HP1 in both male and female adult flies (red) and for the genes that are bound by HP1 in either male or female adult flies, but not in both (blue).