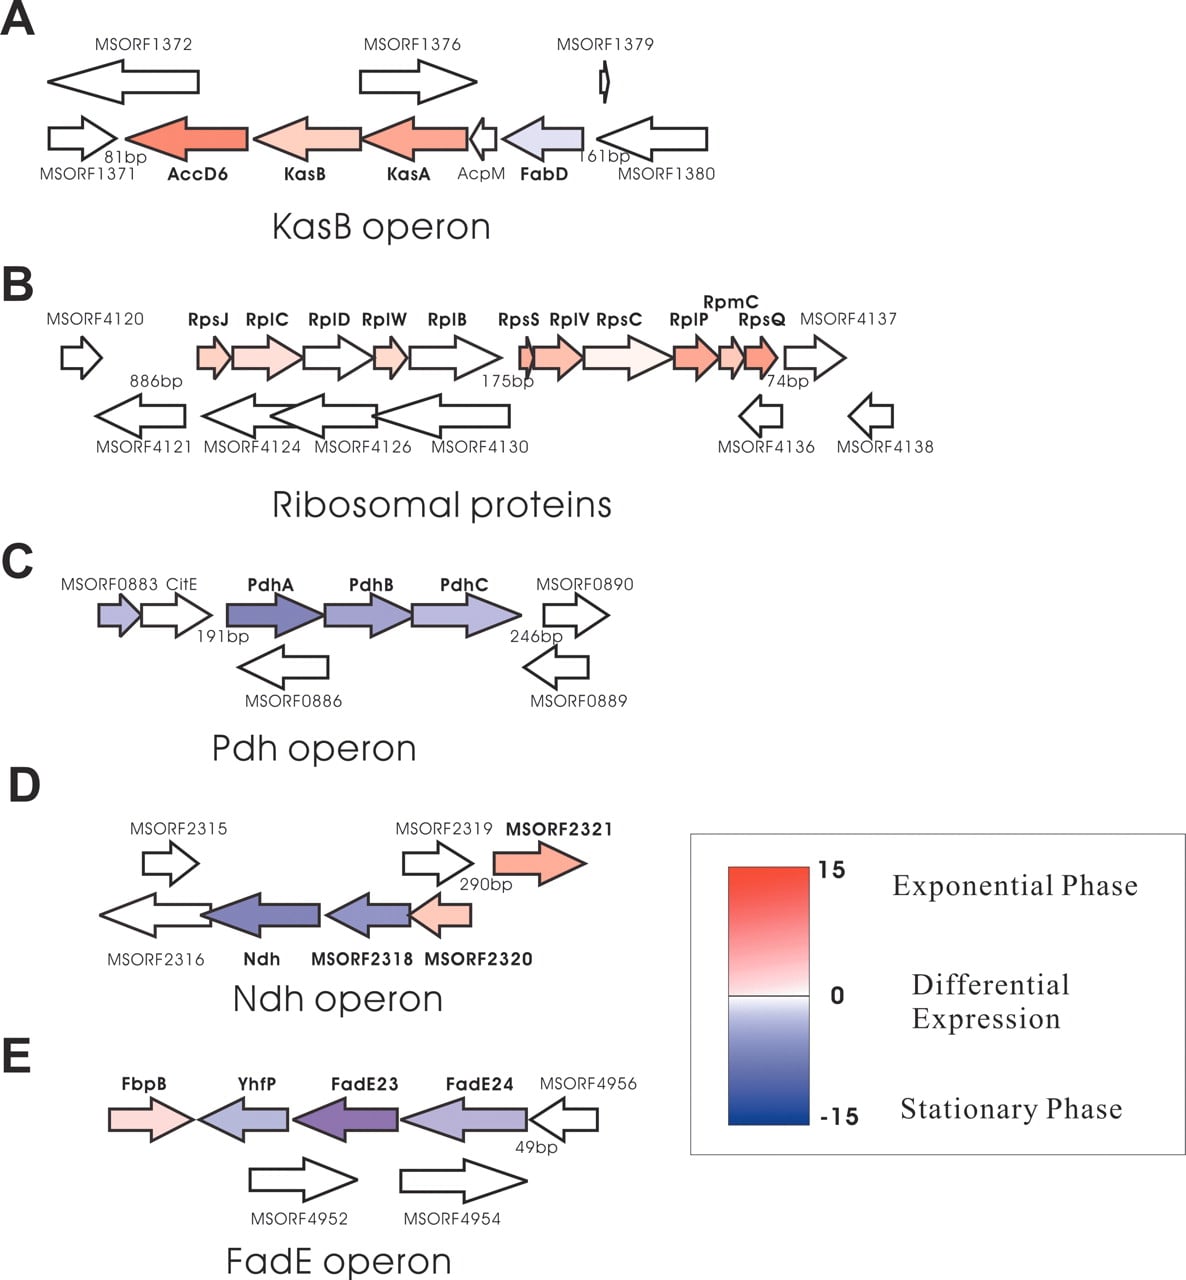
Figure 6.
Proteins in the same operon coexpress in a growth-phase-specific manner. The color scale represents the relative expression of the protein between exponential phase (red) and stationary phase (blue), calculated as (number of observations in exponential phase) [TeX:] \batchmode \documentclass[fleqn,10pt,legalpaper]{article} \usepackage{amssymb} \usepackage{amsfonts} \usepackage{amsmath} \pagestyle{empty} \begin{document} \(-\frac{3}{2}\) \end{document} (number of observations in stationary phase). The KasB operon (A) and RpsJ, RpsS operons (B) are up-regulated in exponential phase; the PdhABC (C), Ndh operon (D), and FadE operon (E) are up-regulated in stationary phase.