Figure 2.
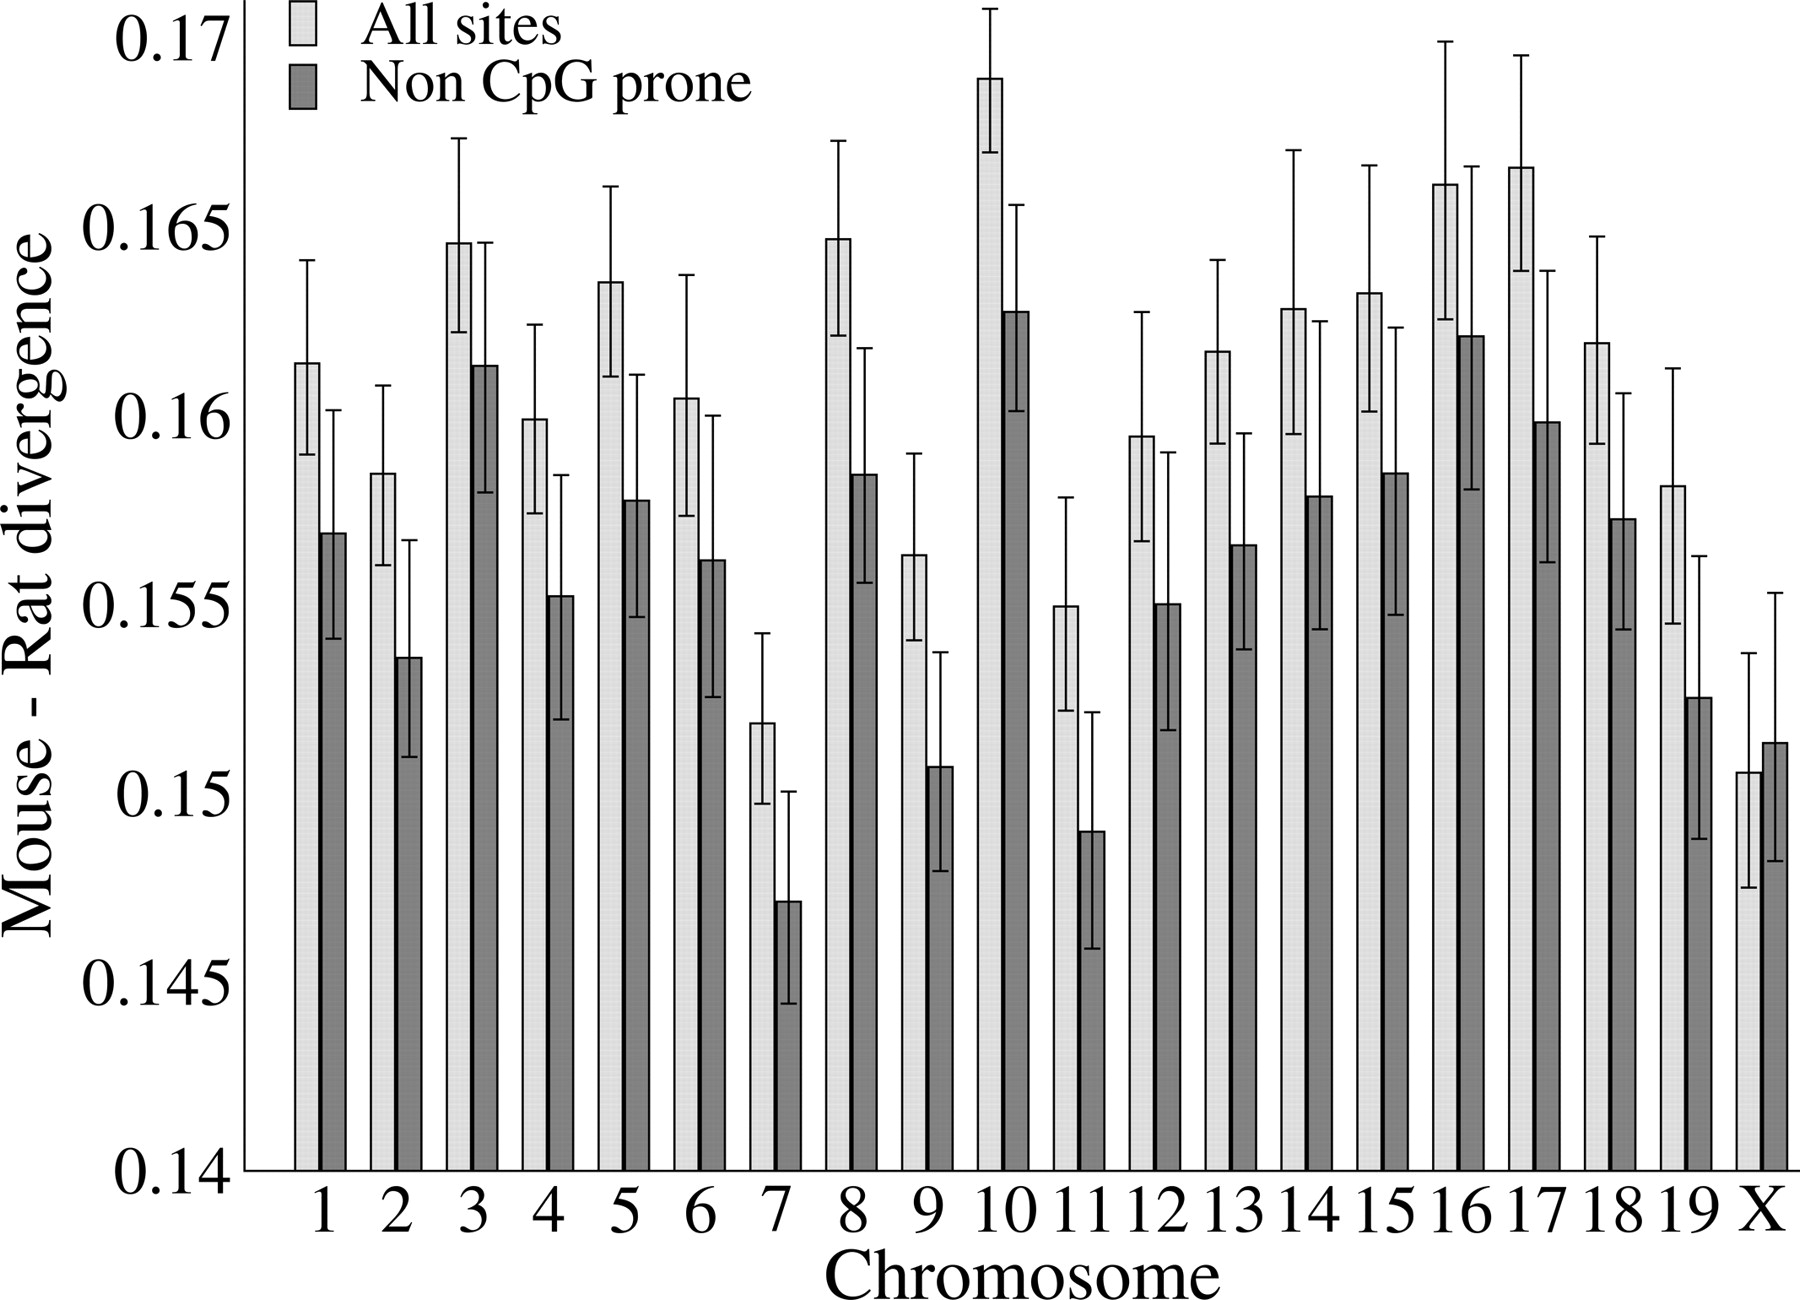
Estimated average nucleotide substitution rates at all sites and non-CpG-prone sites for each mouse chromosome. Bars show the 95% bootstrap confidence intervals.
Estimated average nucleotide substitution rates at all sites and non-CpG-prone sites for each mouse chromosome. Bars show the 95% bootstrap confidence intervals.