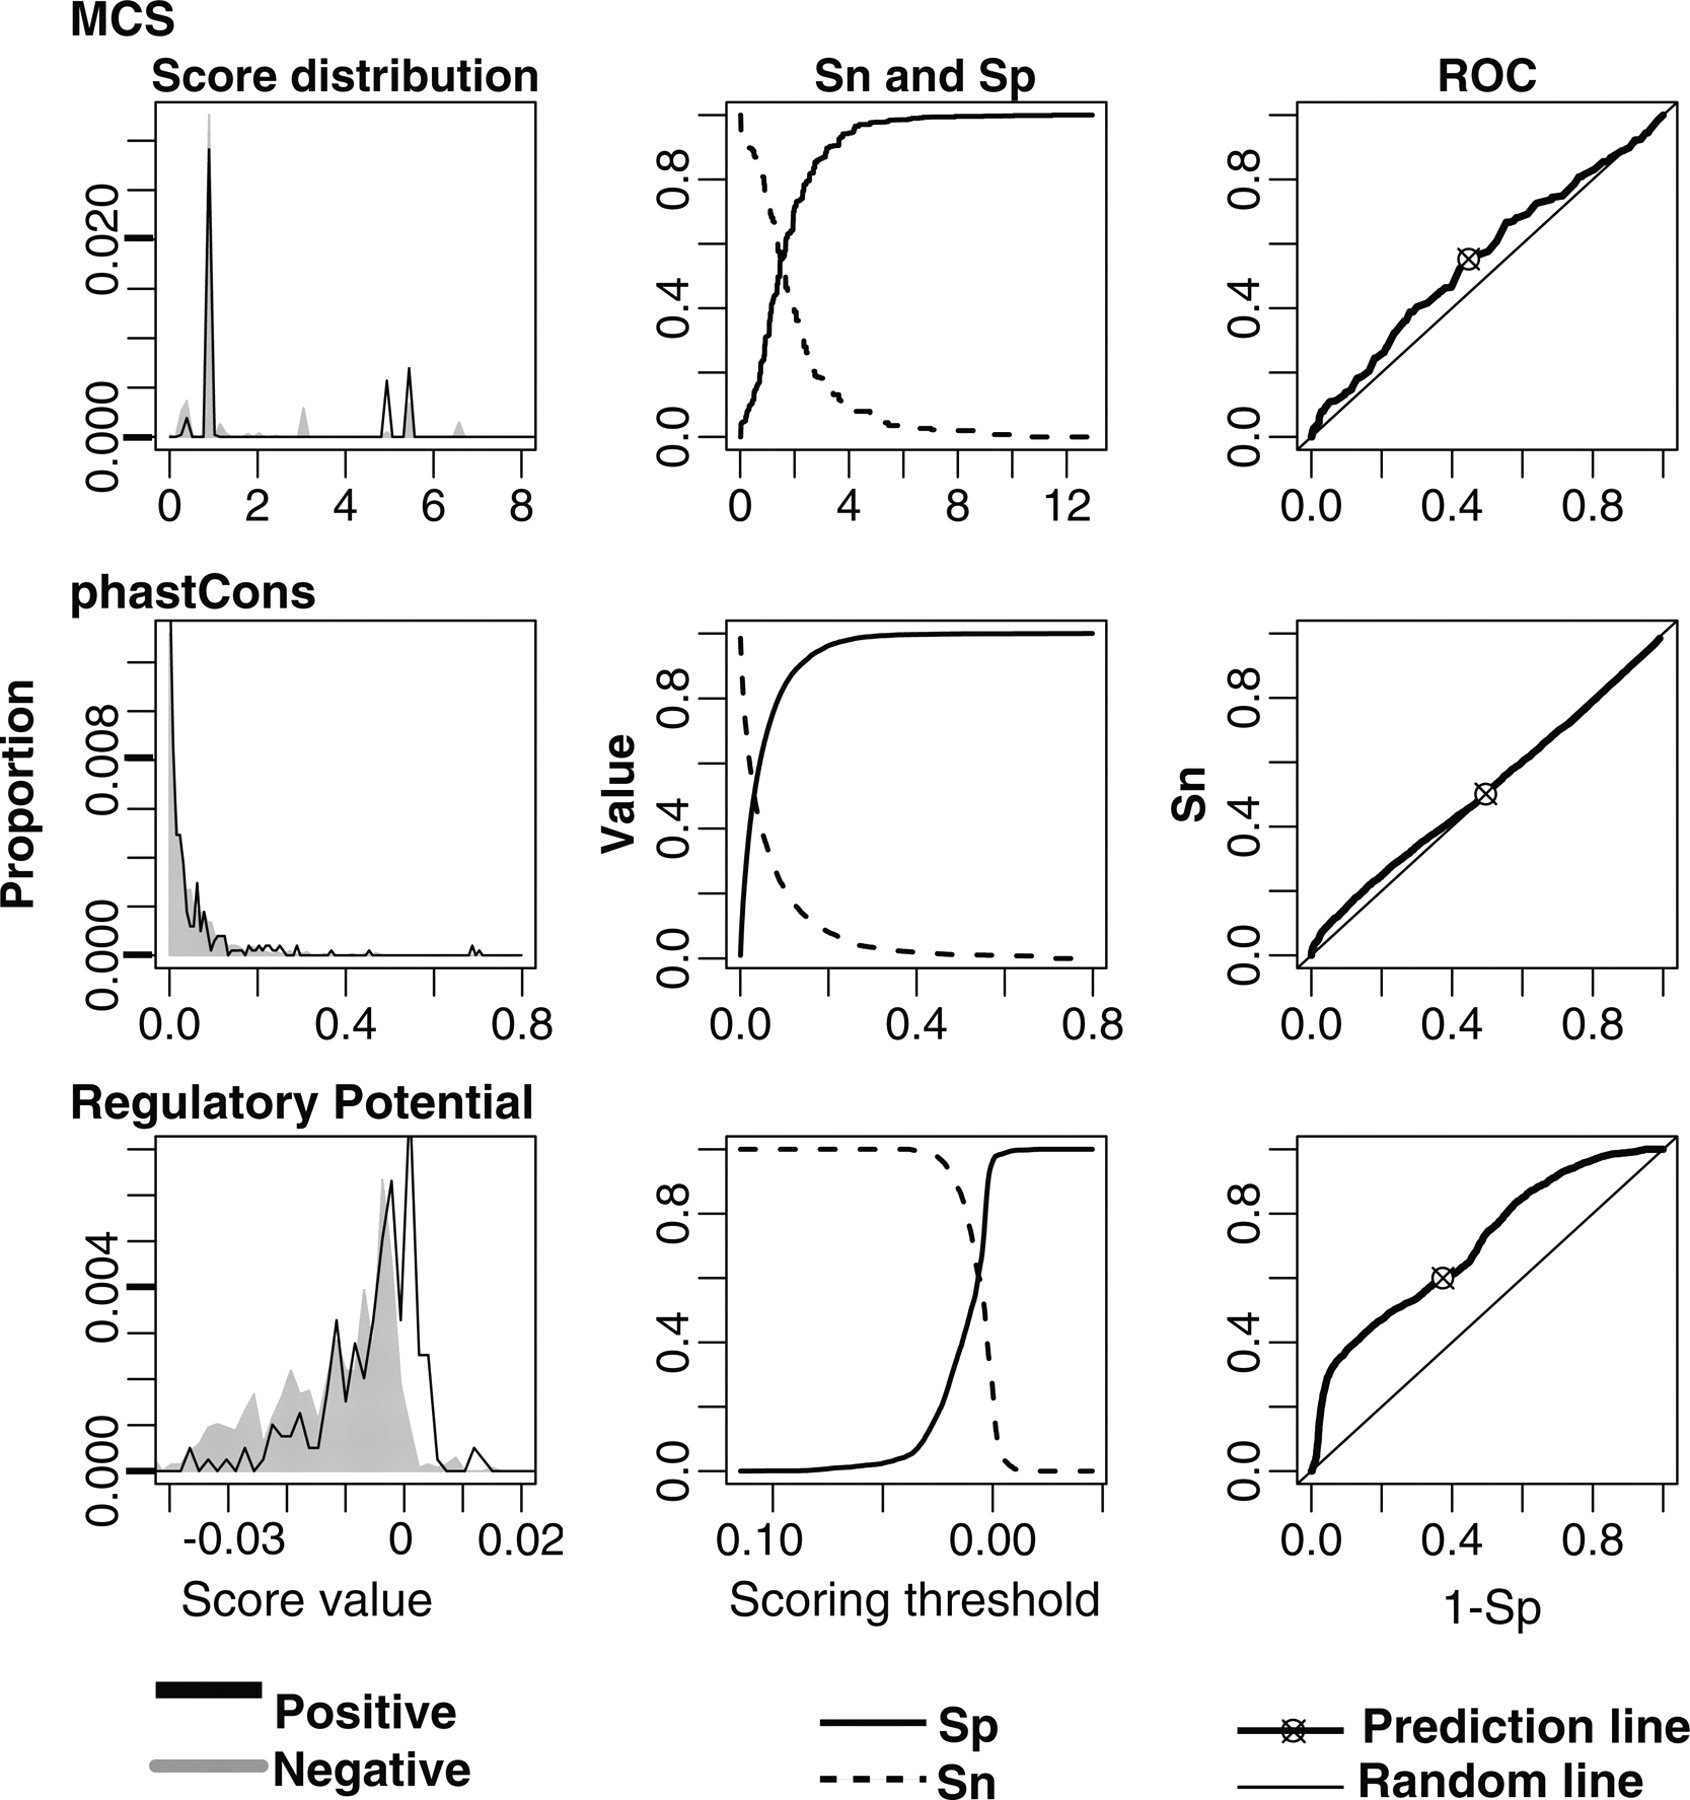
Ability to identify positions in CRMs in the HBB gene complex for three scoring methods based on human–mouse–rat alignments. The graphs in the left column display the lowess-smoothed distribution of scores at positions in noncoding alignments for the regulatory regions (positives, black line) and the nonregulatory regions (negatives, gray area). The graphs in the center column display the sensitivity (Sn, dashed line) and specificity (Sp, solid line) of each method, determined by the fraction of each distribution in the left columns that is above and below the scoring thresholds. The receiver-operator characteristic (ROC) graphs plot Sn versus 1 – Sp for each scoring threshold (thick line). The values at the optimal threshold are plotted as the circle with the cross hairs. The expectation for a random signal follows the diagonal thin line.