Figure 2.
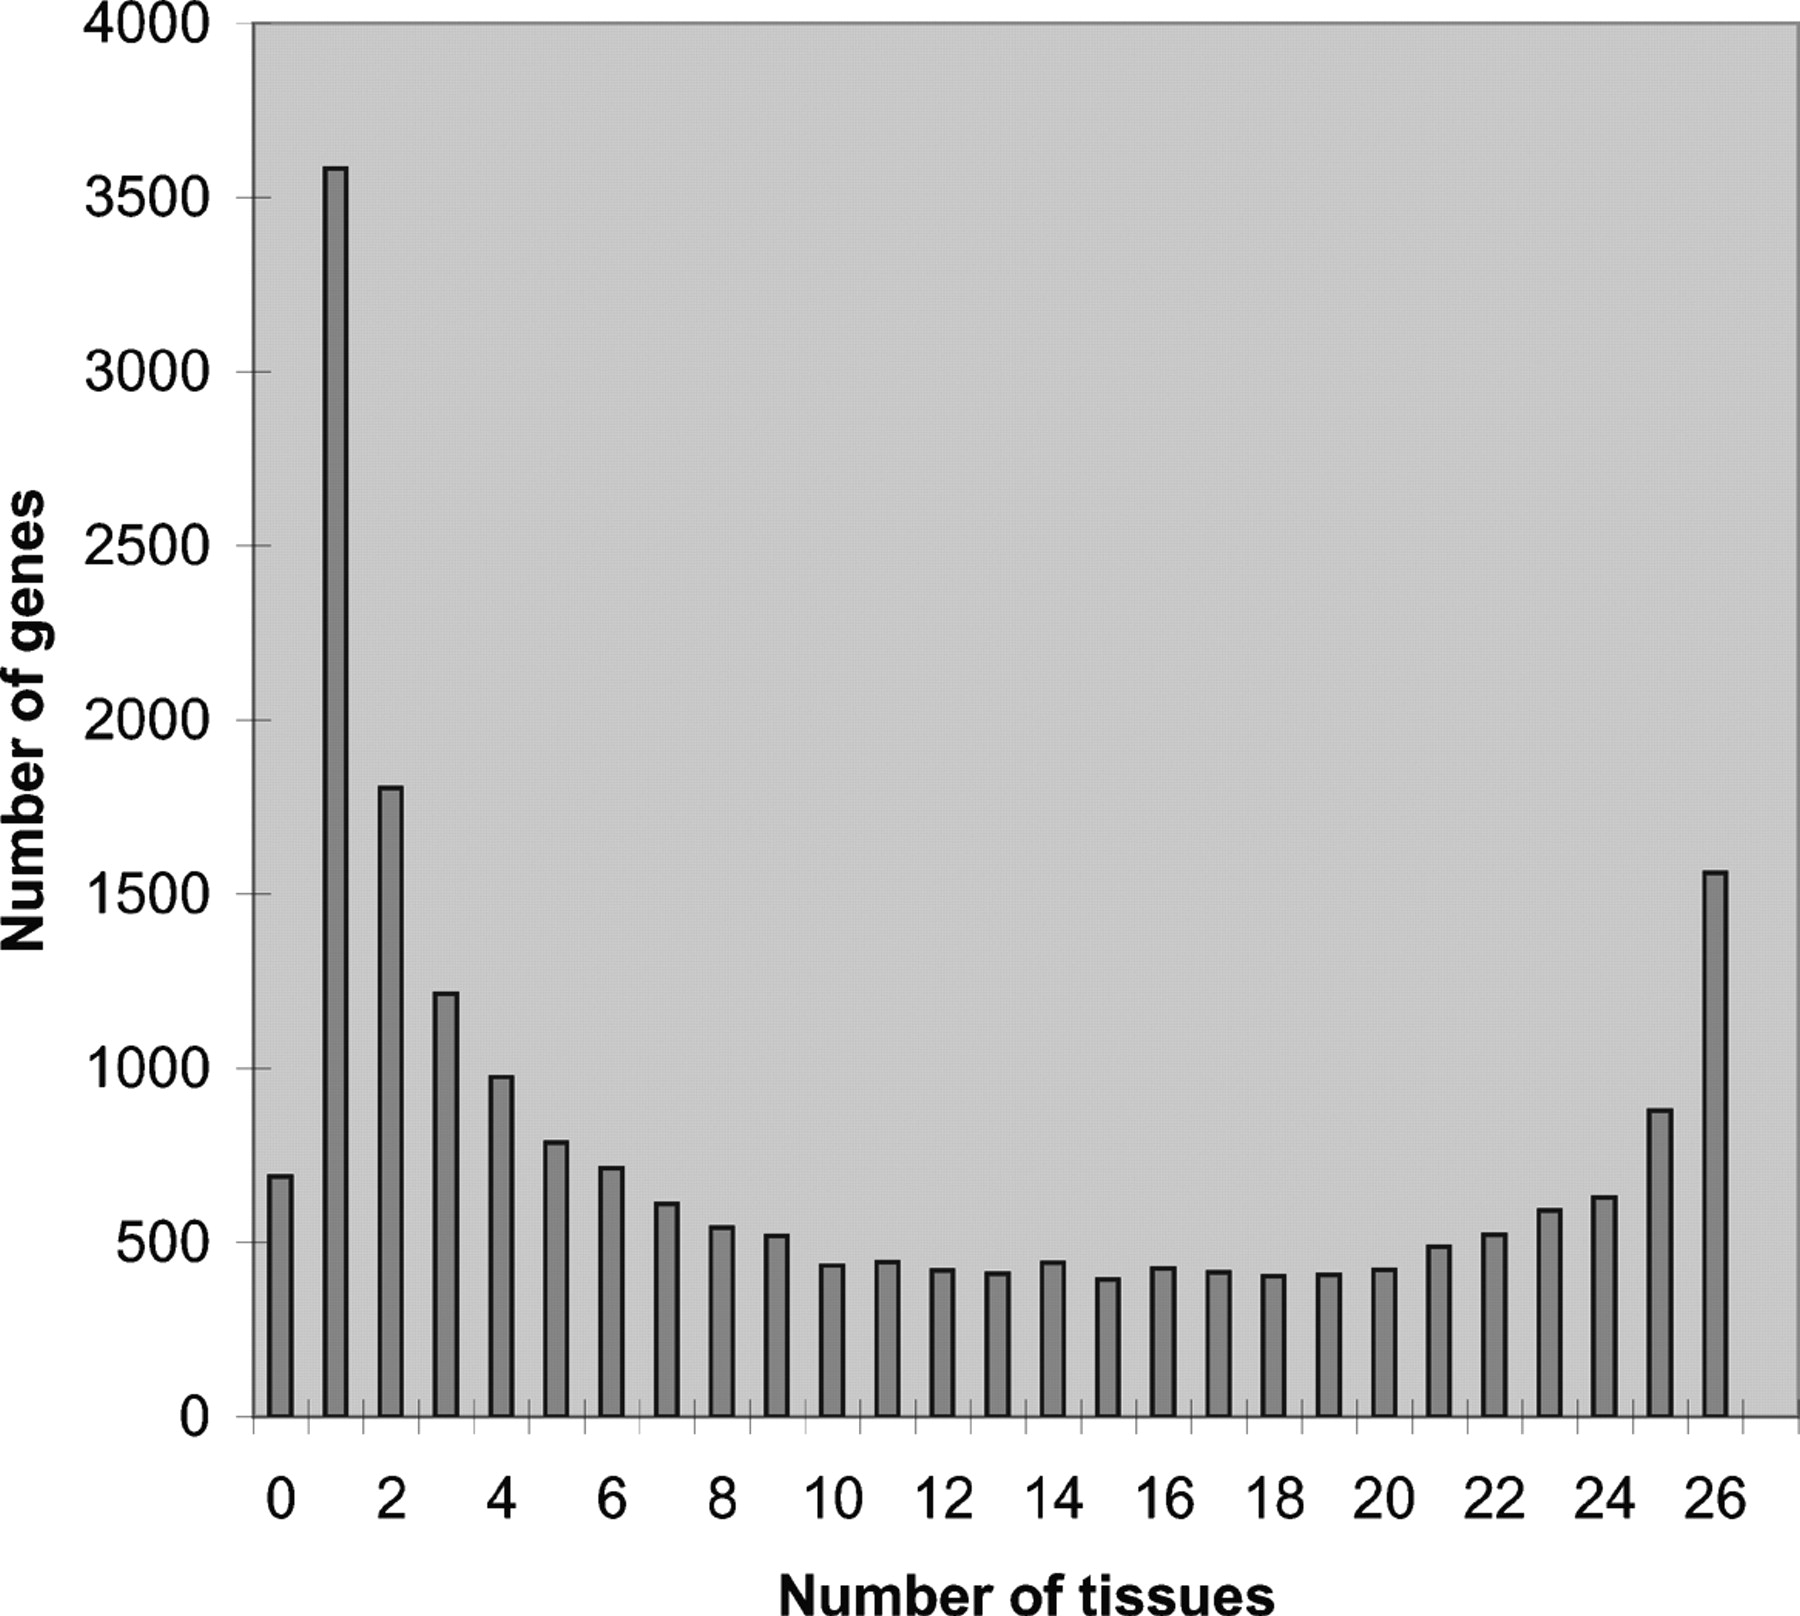
Frequency histogram of gene expression. For each of the genes, the tissues showing expression at 5 tpm or more were counted. The CNS samples were averaged and counted as a single tissue.
Frequency histogram of gene expression. For each of the genes, the tissues showing expression at 5 tpm or more were counted. The CNS samples were averaged and counted as a single tissue.