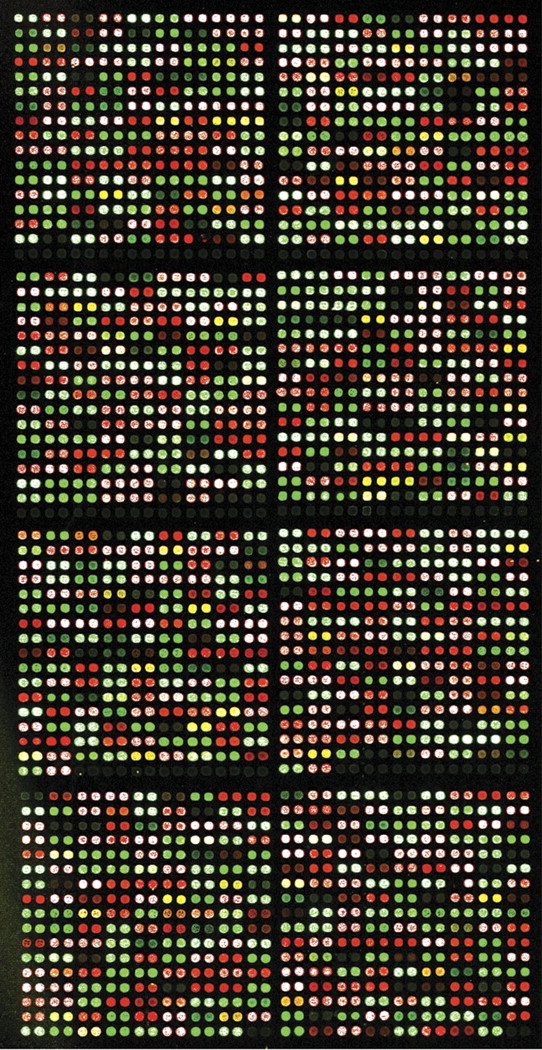
A microarray image from the analysis of single sperm with Group II SNPs. Each probe was printed twice as neighboring spots on the microarray. Spots in red and green, homozygous; yellow, heterozygous; white, pink, and light green, spots with strong signal that have exceeded the linear range; and dark, low signal but not necessarily mean no signal or too low for genotype calls. Yellow spots are either from SNPs that were not real because of the presences of a small portion of SNPs consisting of paralogous sequence variants in the databases (Cheung et al. 2003; Fredman et al. 2004), or from a low level (∼5%) of contamination as demonstrated in the previous studies (Cui et al. 1989; Goradia et al. 1991), which has been shown to be from oligonucleotides synthesized by the current hemi-open-oligonucleotide synthesis system. Note that heterozygous SNPs are treated as uninformative in genetic analyses with single sperm.