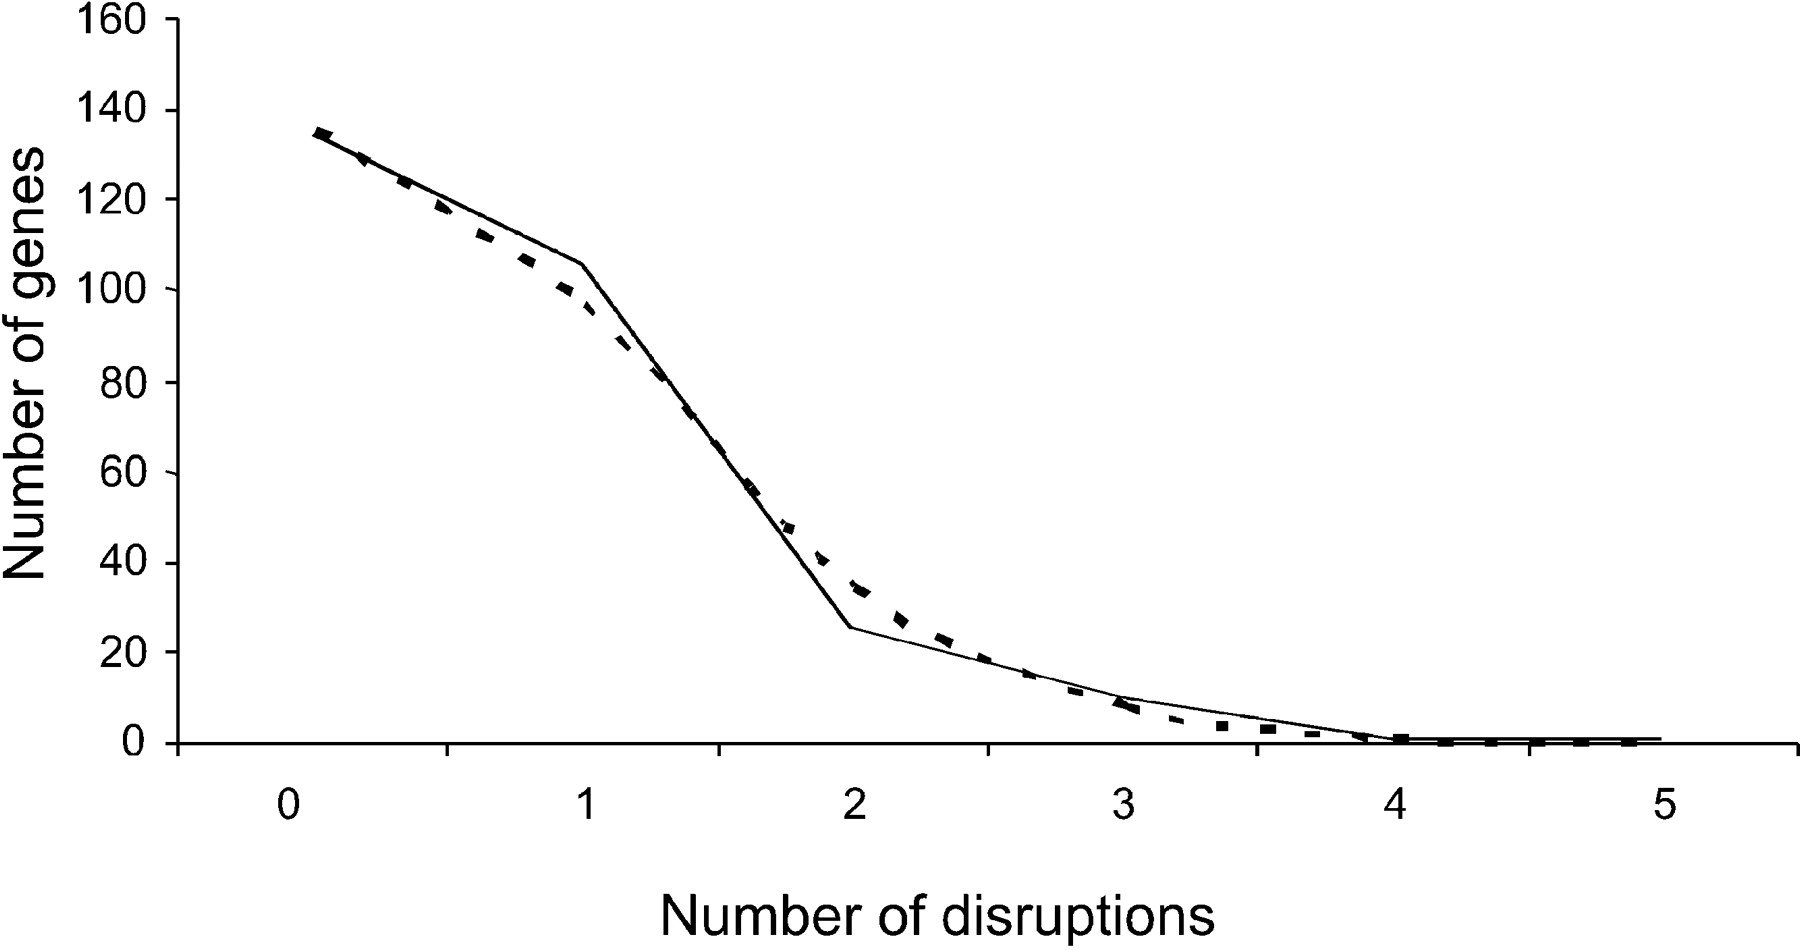
The distribution of human-specific OR gene disruptions. The broken line is the Poisson fit for the data (λ = 0.701).