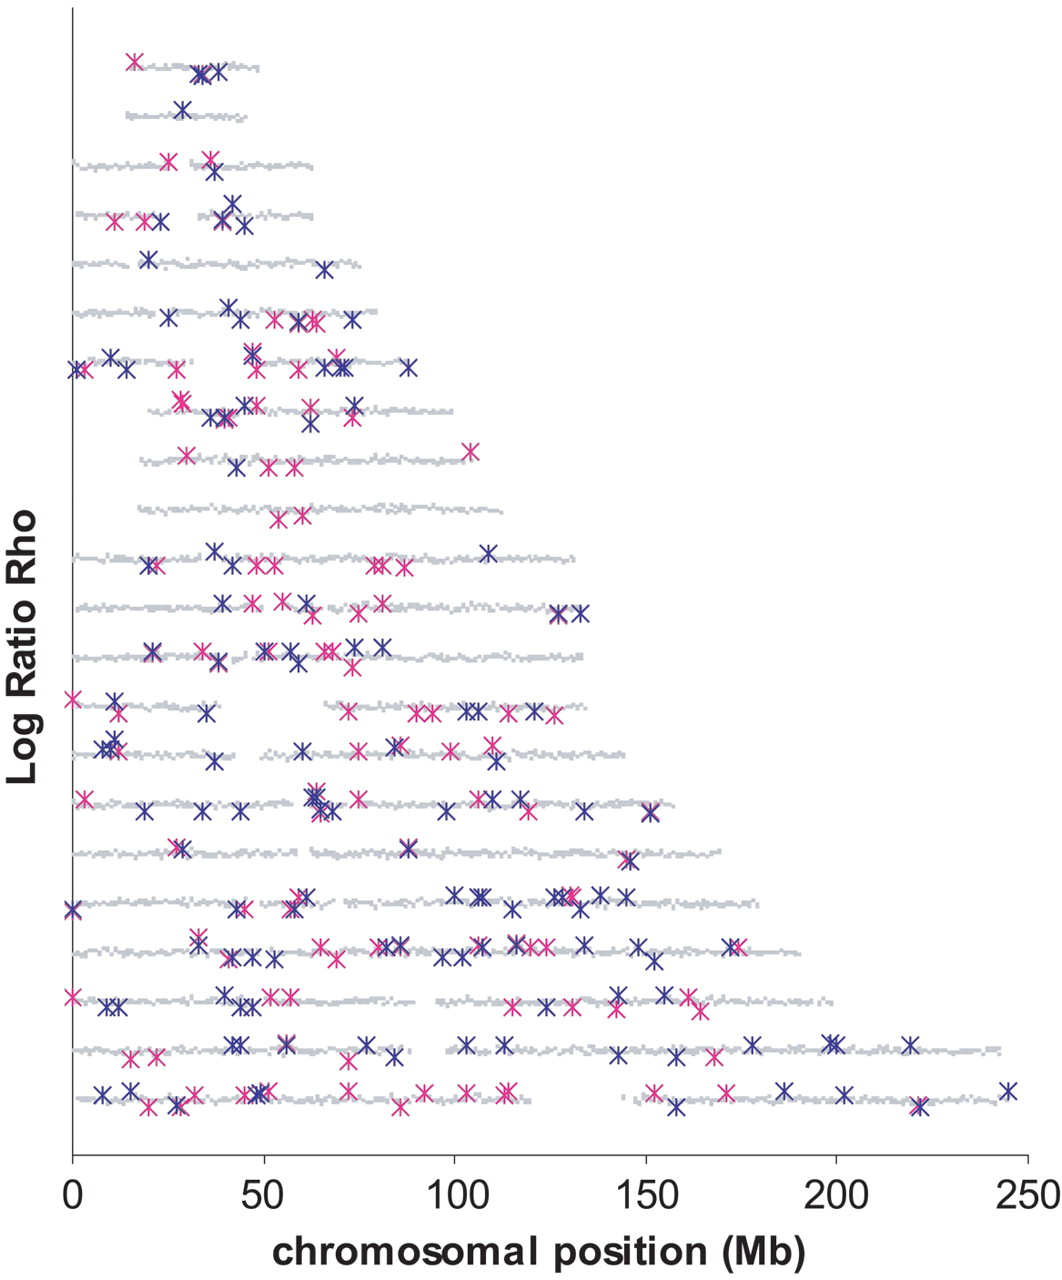
Position of the windows with the 5% most extreme log ratios [TeX:] \batchmode \documentclass[fleqn,10pt,legalpaper]{article} \usepackage{amssymb} \usepackage{amsfonts} \usepackage{amsmath} \pagestyle{empty} \begin{document} \({\hat{{\rho}}}_{\mathrm{pop}1}{/}{\hat{{\rho}}}_{\mathrm{pop}2}\) \end{document} . The chromosomes are organized according to their number from 1 (lowest y-axis coordinate) to 22 (on top). Each gray point represents the value of the log ratio [TeX:] \batchmode \documentclass[fleqn,10pt,legalpaper]{article} \usepackage{amssymb} \usepackage{amsfonts} \usepackage{amsmath} \pagestyle{empty} \begin{document} \({\hat{{\rho}}}_{\mathrm{pop}1}{/}{\hat{{\rho}}}_{\mathrm{pop}2}\) \end{document} for one 1-Mb window and is displayed according to its position on the chromosome (on the x-axis). The 5% most extreme log ratios [TeX:] \batchmode \documentclass[fleqn,10pt,legalpaper]{article} \usepackage{amssymb} \usepackage{amsfonts} \usepackage{amsmath} \pagestyle{empty} \begin{document} \({\hat{{\rho}}}_{\mathrm{Afr.-Amer.}}{/}{\hat{{\rho}}}_{\mathrm{Eur.-Amer.}}\) \end{document} are shown in blue and [TeX:] \batchmode \documentclass[fleqn,10pt,legalpaper]{article} \usepackage{amssymb} \usepackage{amsfonts} \usepackage{amsmath} \pagestyle{empty} \begin{document} \({\hat{{\rho}}}_{\mathrm{Afr.-Amer.}}{/}{\hat{{\rho}}}_{\mathrm{HanChin.}}\) \end{document} in pink. See also Supplemental Figure S23 for a blowup of Chromosomes 1 to 5 and Supplemental Figure S24 for the 5% most extreme log ratios [TeX:] \batchmode \documentclass[fleqn,10pt,legalpaper]{article} \usepackage{amssymb} \usepackage{amsfonts} \usepackage{amsmath} \pagestyle{empty} \begin{document} \({\hat{{\rho}}}_{\mathrm{Eur.-Amer.}}{/}{\hat{{\rho}}}_{\mathrm{HanChin}}\) \end{document} .