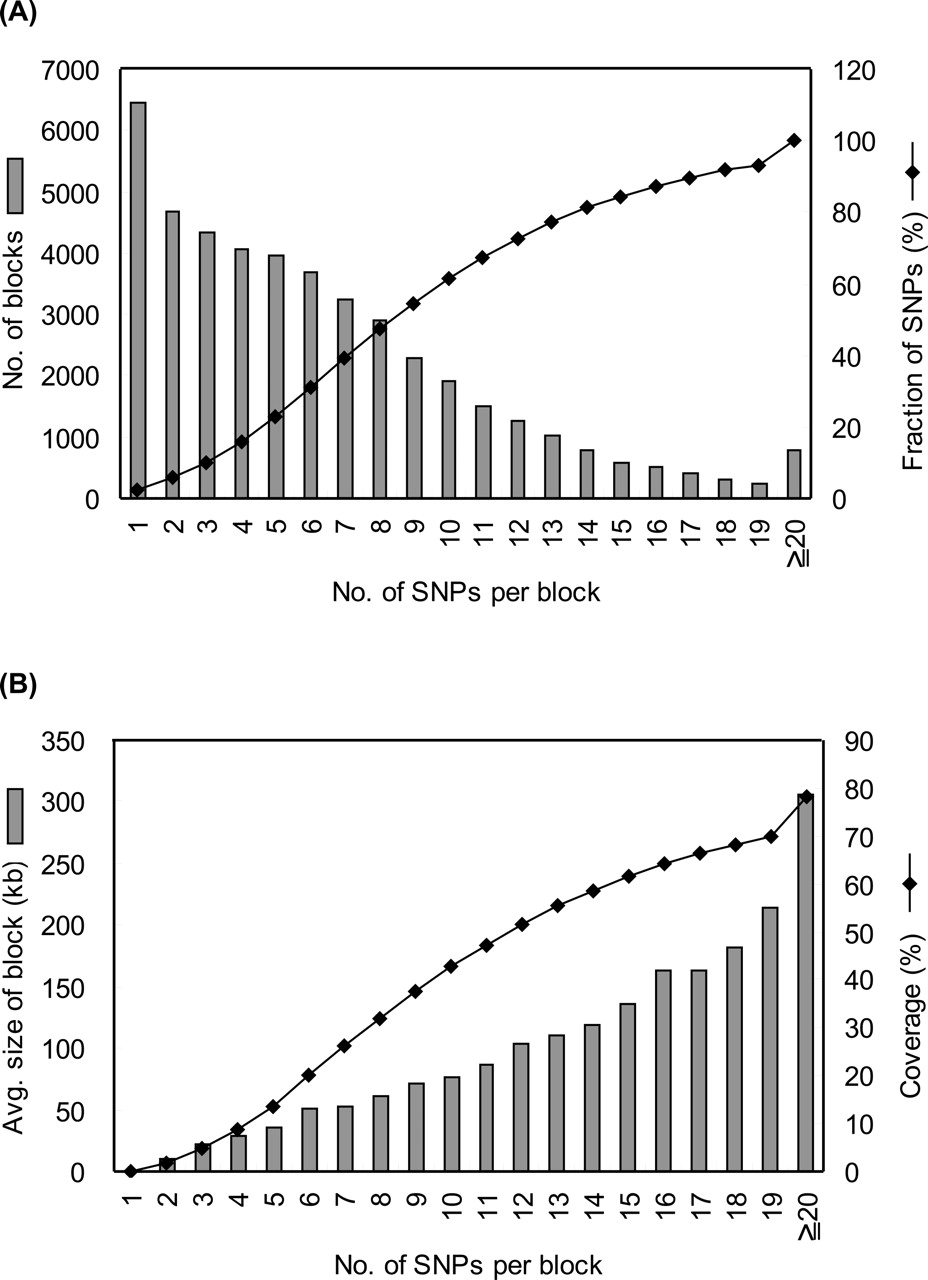
Figure 3.
Gross characteristics of haplotype blocks. (A) Blocks were classified by the number of SNPs per block. The histogram shows the number of blocks in each class. The line plot shows the cumulative fraction of SNPs covered by the blocks. (B) Block size and genome coverage classified by the number of SNPs per block. The histogram shows the average size of blocks. The line plot shows cumulative genome coverage of blocks. A genome size of 2.93 Gb is assumed, which is the summation of regions between the first and last SNPs on chromosomes of Build 35, including centromeres.