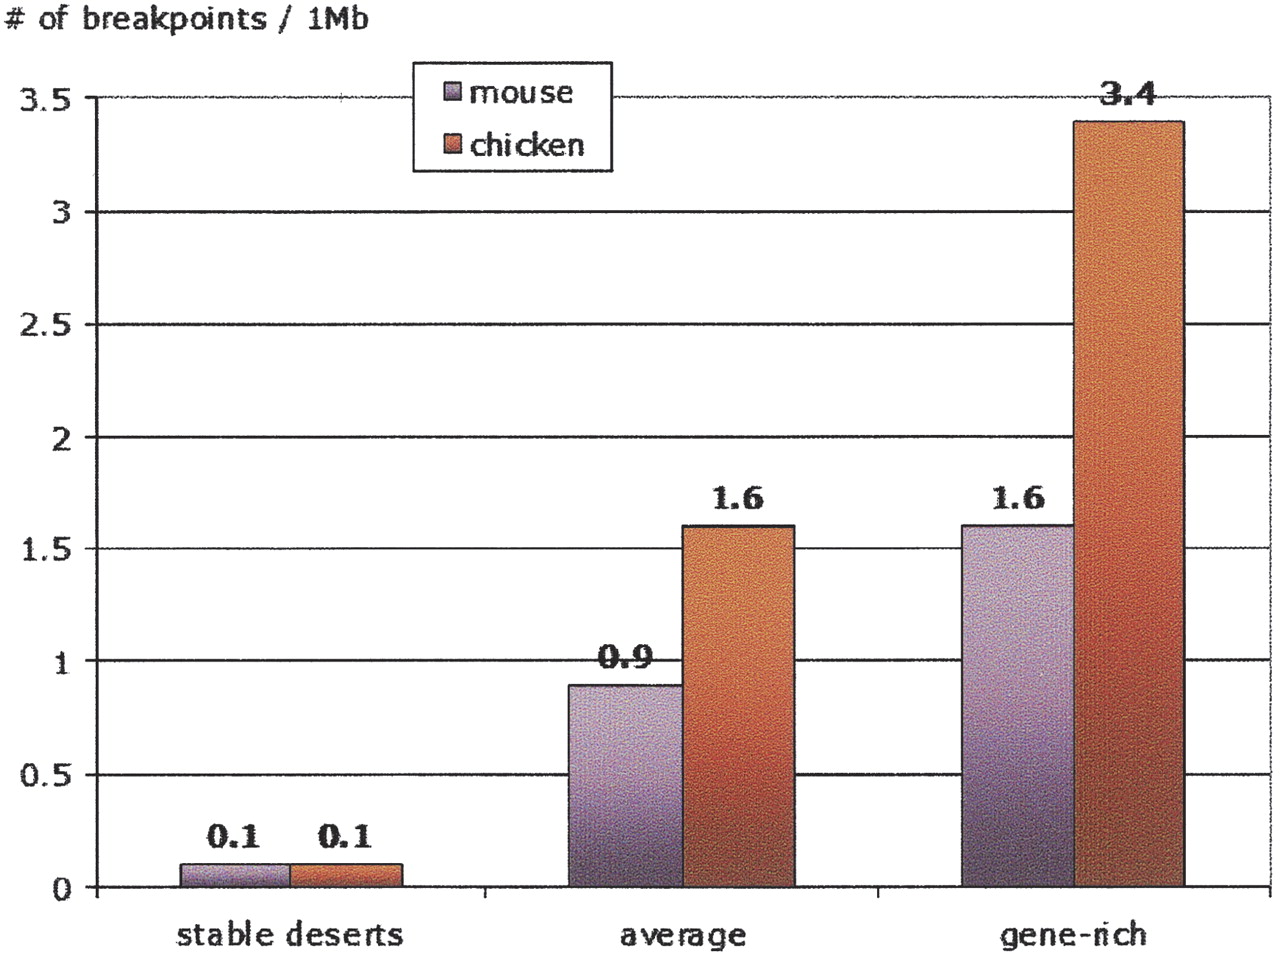
Density of synteny breakpoints per 1 Mb of sequence. Human–mouse comparisons are in orange; human–chicken in lilac.