Figure 2
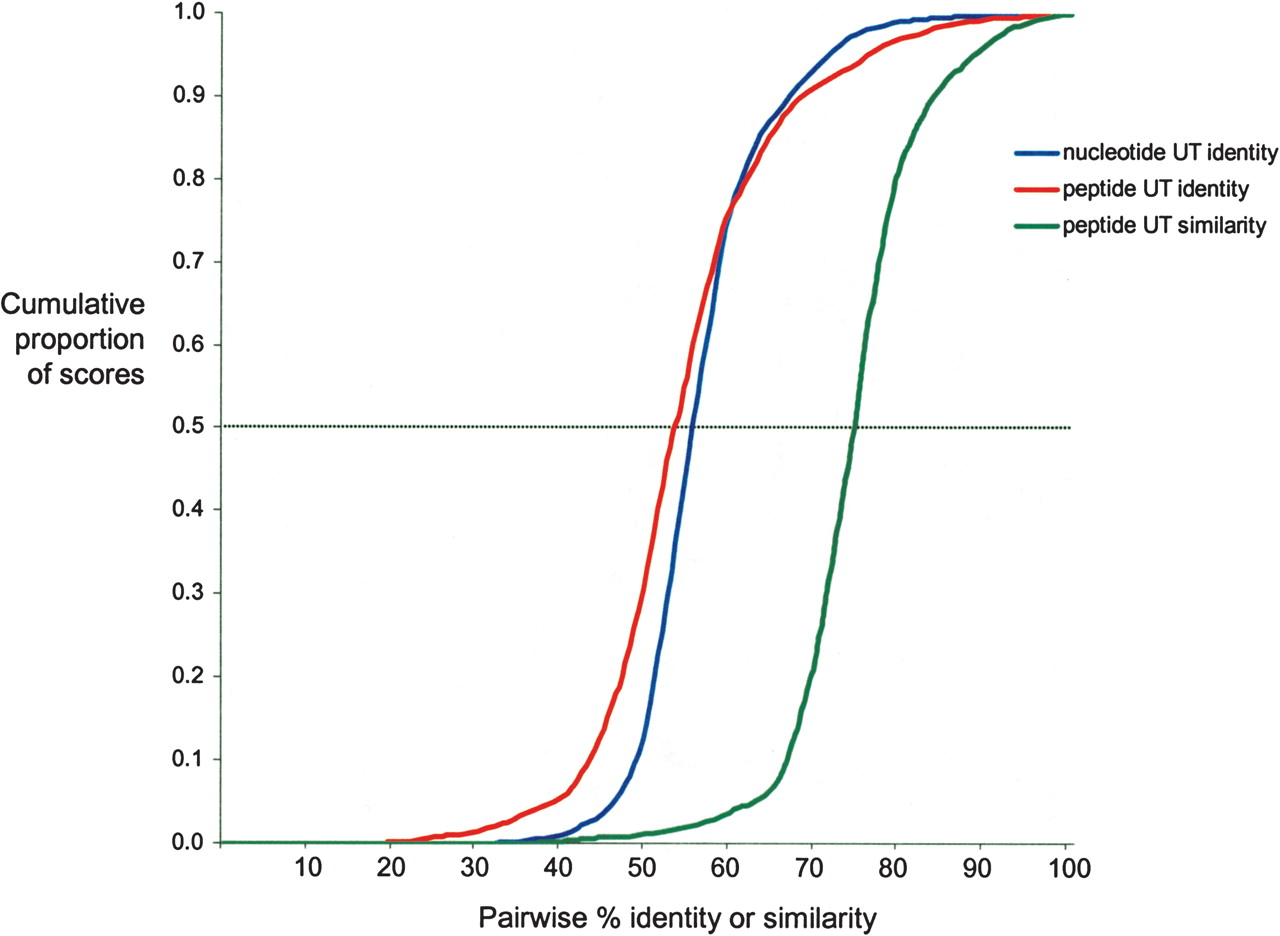
Cumulative frequency distribution plot of pairwise UT nucleotide sequence identity and pairwise UT peptide sequence identity and similarity for representatives of each of 247 bacterial and eukaryotic genera.
Cumulative frequency distribution plot of pairwise UT nucleotide sequence identity and pairwise UT peptide sequence identity and similarity for representatives of each of 247 bacterial and eukaryotic genera.