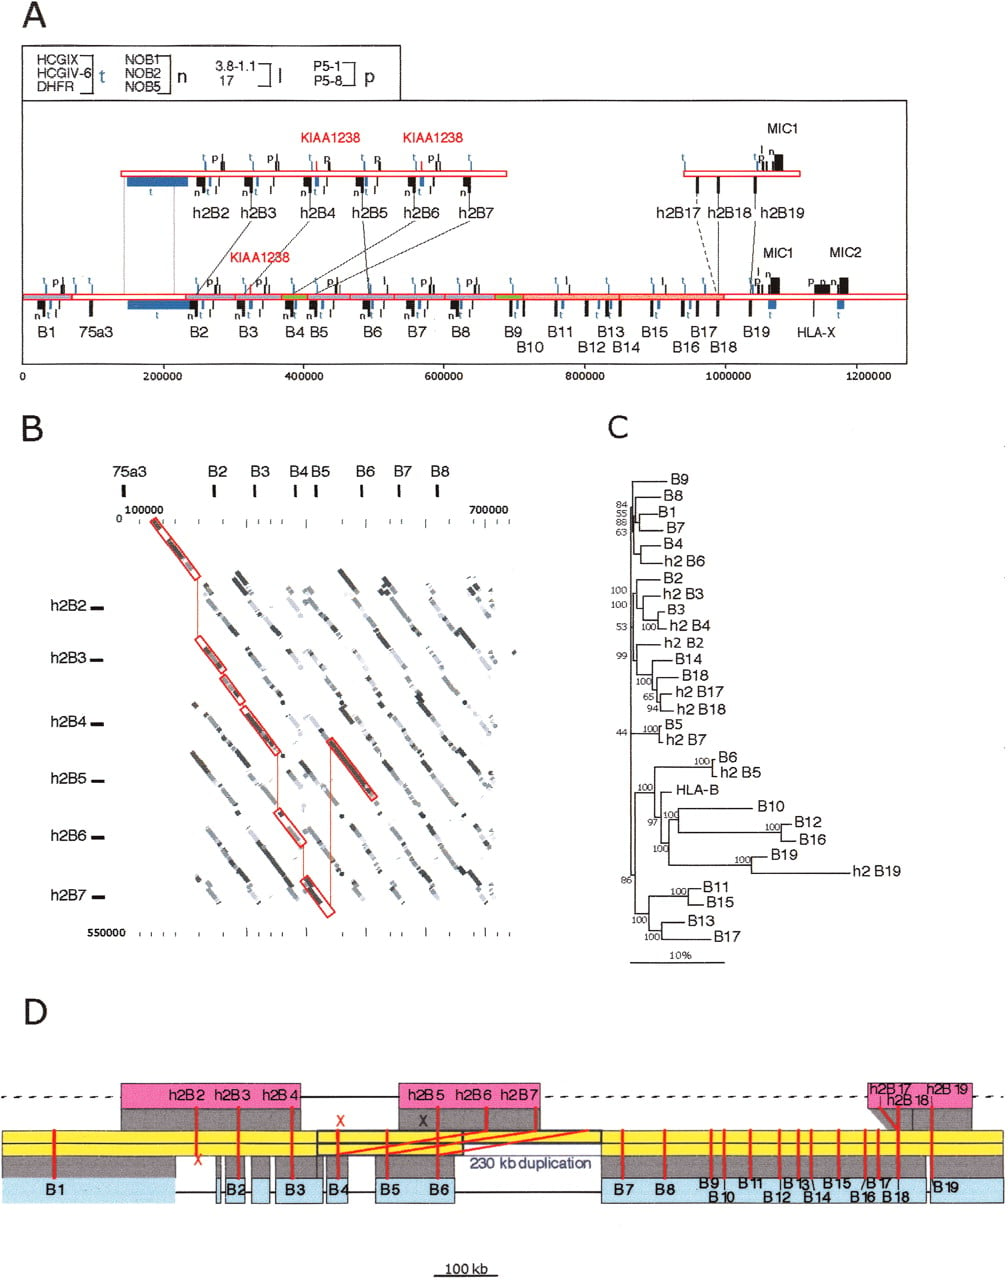
Comparison of two mamu-B haplotype sequences. (A) Two segments from haplotype 2 spanning 564 and 181 kb from the telomeric and centromeric ends of the region, respectively, are aligned above the corresponding complete haplotype 1 segment. Genes and other sequences are indicated as described in the legend to Figure 3. Lines between the top and bottom mamu-B genes indicate the most closely related sequences between the two haplotypes (alleles). (B) Dot matrix similarity between the segments from haplotype 2 containing h2-B2 though h2-B7 and the B2 though B8 segment from haplotype 1. Shading of dots indicates percent identity in equal integer gradations from 5% gray (90% identity) to black (100% identity). Red lines enclose and connect the matrix at positions that have the highest percent similarity between loci from the respective haplotypes. The comparisons were done using cross_match as described in the legend to Figure 2. Tick marks indicate the scale in 100-kb segments on the vertical and 20 kb on the horizontal. The locations of the class I genes from haplotype 2 are indicated in relative positions at top and to the left. (C) Phylogenetic analysis of all mamu-B-like genes, based on 5 kb of genomic sequence surrounding each gene. Included in this analysis are all B genes listed in Table 2. A multiple alignment of the repeat-masked genomic sequences was performed using ClustalW with default parameters. Phylogenetic reconstruction was generated using the Neighbor-Joining algorithm (Saitou and Nei 1987), and tested using 1000 rounds of bootstrap analysis. The tree is unrooted. The horizontal bar indicates 10% divergence along each branch. (D) Reconstruction of the evolution of haplotype 1 (blue) and haplotype 2 (red) from the ancestral sequence (yellow), by way of a 230-kb duplication (between the blue boxes), followed by deletions on both sides (black horizontal lines). Dashed gray lines indicate yet unavailable sequence. Red lines connect alleles of mamu-B genes; (x) deleted alleles.