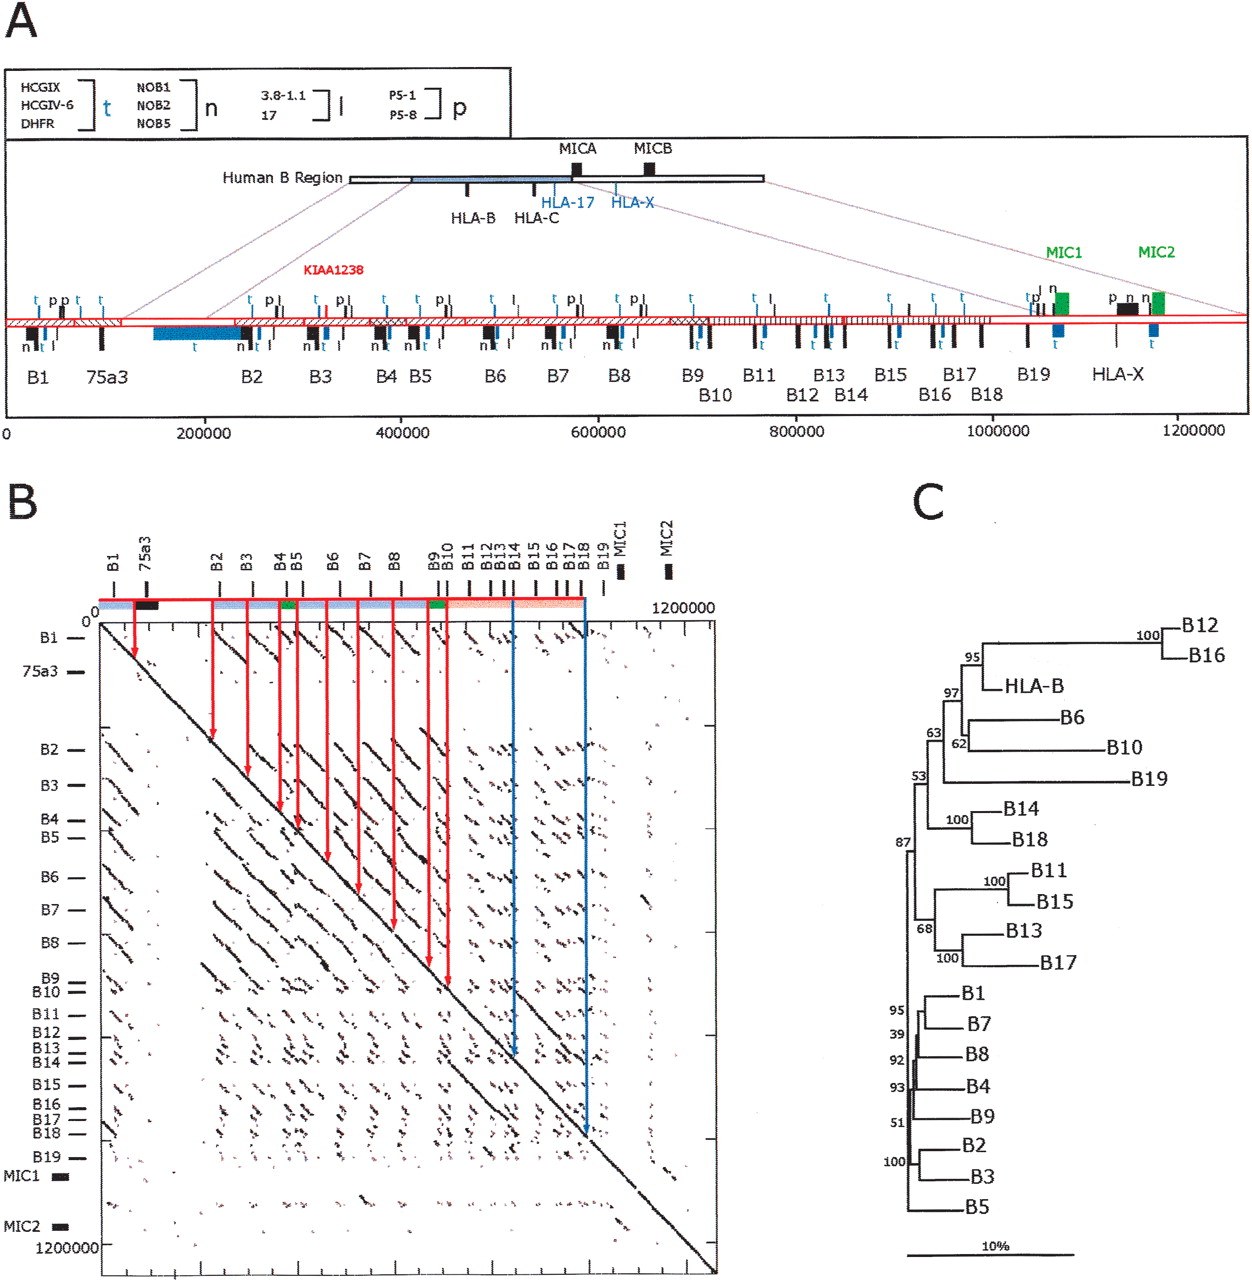
Analysis of a complete mamu class I B region haplotype. (A) Comparison of human and mamu-B region segments. Top cartoon depicts the homologous human segment extending to scale over the HLA-B and HLA-C region, including the surrounding class I loci as indicated. Immediately beneath is depicted the mamu-B region extending 1.3 Mb and including 19 mamu-B-like genes (see Table 2 for gene summary). Segments of similarity between rhesus and human are bounded by lines connecting the two cartoons. The positions of homologs to human genes and pseudogenes are indicated with bars and symbols that are explained in the top, left box. Orthologous genes with conserved functional structure are indicated by green bars and text. Segments with significant similarity indicative of past duplication events are indicated with similar hatching bounded by solid lines. The placement of bars above or below the line indicates direction of transcription according to convention. The scale below is in base pairs. (B) Dot matrix analysis of the mamu-B region haplotype 2 against itself. The dot plot was generated by a custom python script that divides the query sequence into 100-kb fragments and compares them using cross_match (Ewing and Green 1998; Ewing et al. 1998) against the target sequence. The minmatch score was set at 30 and the masklevel was set at 101. All other cross_match parameters were set to default values. The start and end positions for each cross_match hit were plotted using the Biggles python module. Tick marks indicate the scale in 200-kb segments on the vertical and 50 kb on the horizontal. The locations of the class I genes are indicated in relative positions at top and to the left. Similarity among segments is indicated by similar coloring within the bar on the top and further bounded by vertical lines within the box. (C) Phylogenetic analysis of all mamu-B-like genes in the region based on 5-kb of genomic sequence surrounding each gene. Included in this analysis are all of those genes from haplotype 1 listed in Table 2. A multiple alignment of the repeat-masked genomic sequences was performed using ClustalW with default parameters. Phylogenetic reconstruction was generated using the Neighbor-Joining algorithm (Saitou and Nei 1987) and tested using 1000 rounds of bootstrap analysis. The tree is unrooted. The horizontal bar indicates 10% divergence along each branch.