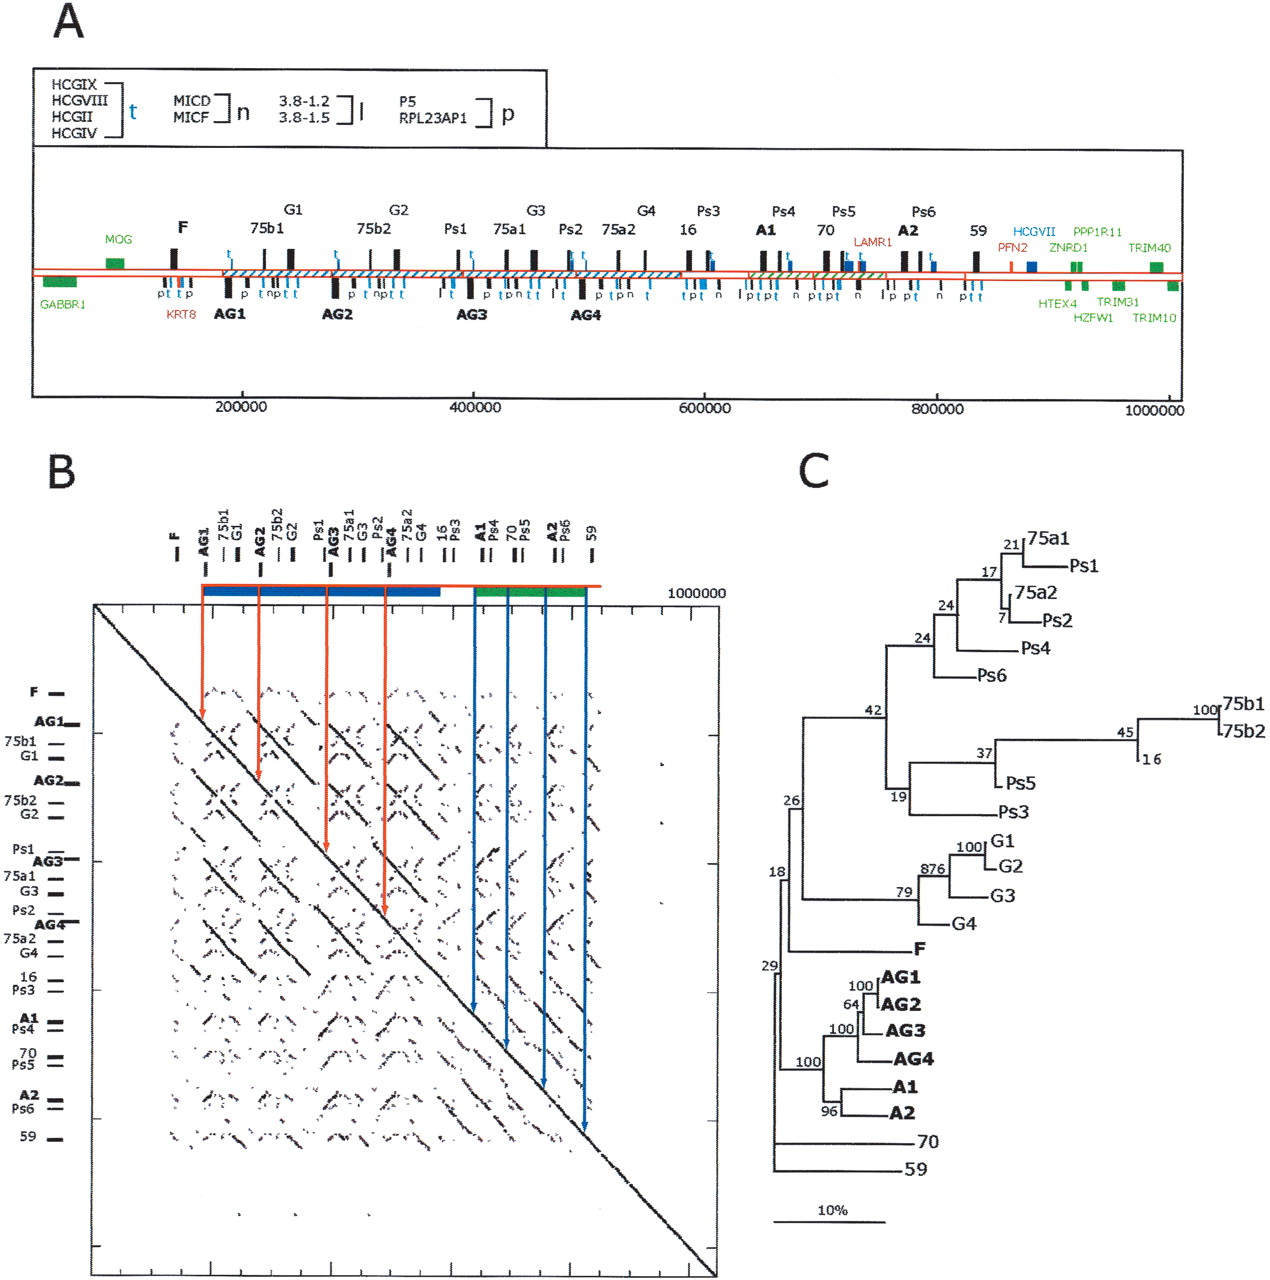
Description of the expanded, relative to human, mamu-A class I gene region. (A) The 1.1 mb segment extending from GABBR1 to TRIM10 from mamu haplotype 2 is depicted. The positions of class I genes and pseudogenes are indicated by alphanumerical descriptions and bars with direction of transcription indicated by positioning above and below the line according to convention (Table 1 contains a summary description). The positions of homologs to non-class I human genes and pseudogenes are indicated with bars and symbols that are explained in the top, left box. Flanking genes outside of this duplicated area and homologous to those found in the human MHC with conserved structures are indicated by green bars and text. Sequences not present in the corresponding human class I region are indicated by red bars and text. Other non-class I genes are colored in blue. Segments of the sequence with significant similarity indicative of duplication events are indicated with similar hatching bounded by solid lines. The scale below is in base pairs. (B) Dot matrix analysis of the mamu-A region against itself to provide a visualization of the repetitive nature of this segment. The dot plot was generated by a custom python script that divides the query sequence into 100-kb fragments and compares them using cross_match (Ewing and Green 1998; Ewing et al. 1998) against the target sequence. The minmatch score was set at 30 and masklevel was set at 101. All other cross_match parameters were set to default values. The start and end positions for each cross_match hits were plotted using the Biggles python module (biggles.sourceforge.net). Tick marks on the vertical indicate the scale in 200-kb segments and on the horizontal in 50-kb segments. The locations of the class I genes are indicated in relative positions at top and to the left.(C) Phylogenetic analysis of the mamu-A region genes and pseudogenes. Included in this analysis are all mamu class I-like genes contained in this segment (Table 1). Conceptual translations were produced by FASTY (Pearson et al. 1997) comparison of the genomic sequence of each gene or pseudogene with the human HLA-A24 gene (SwissProt 1A24_HUMAN), correcting frameshifts and stop codons of pseudogenes and partial genes. The reconstructed amino acid sequences were aligned using ClustalW with default parameters. Phylogenetic reconstruction was generated using the Neighbor-Joining algorithm (Saitou and Nei 1987), and tested using 1000 rounds of bootstrap analysis. The tree is unrooted. The horizontal bar indicates 10% divergence along each branch.