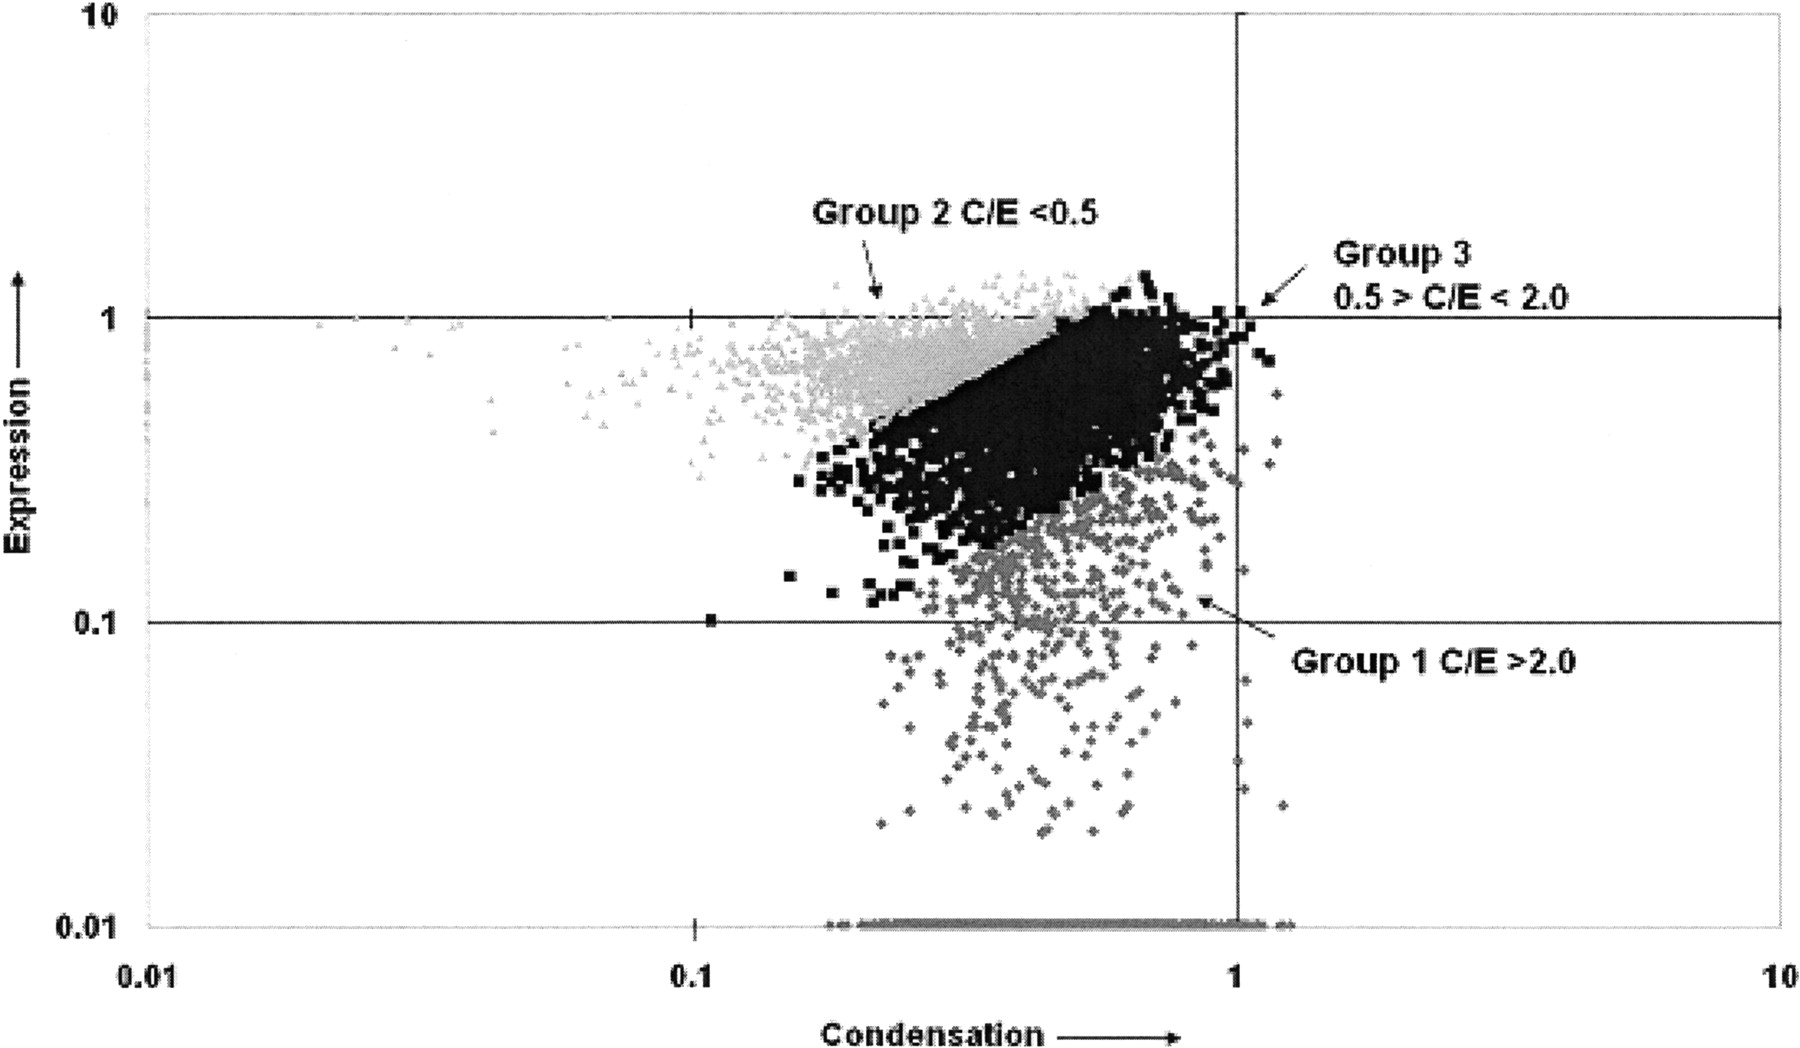
Figure 2
The log scale scatter plot of the co-normalized intensities (sequence abundances) illustrates the relationship between condensation (the ratio of the S2 fraction intensity to total genomic DNA intensity) and the absolute RNA expression. The light gray triangles are Group 2, which has a condensation to expression (C/E) ratio of <0.5. The black squares represent Group 3, which has indeterminate accessibility and a C/E ratio of <2.0 to >0.5. The gray diamonds represent Group 1, which has a C/E ratio of >2.0.