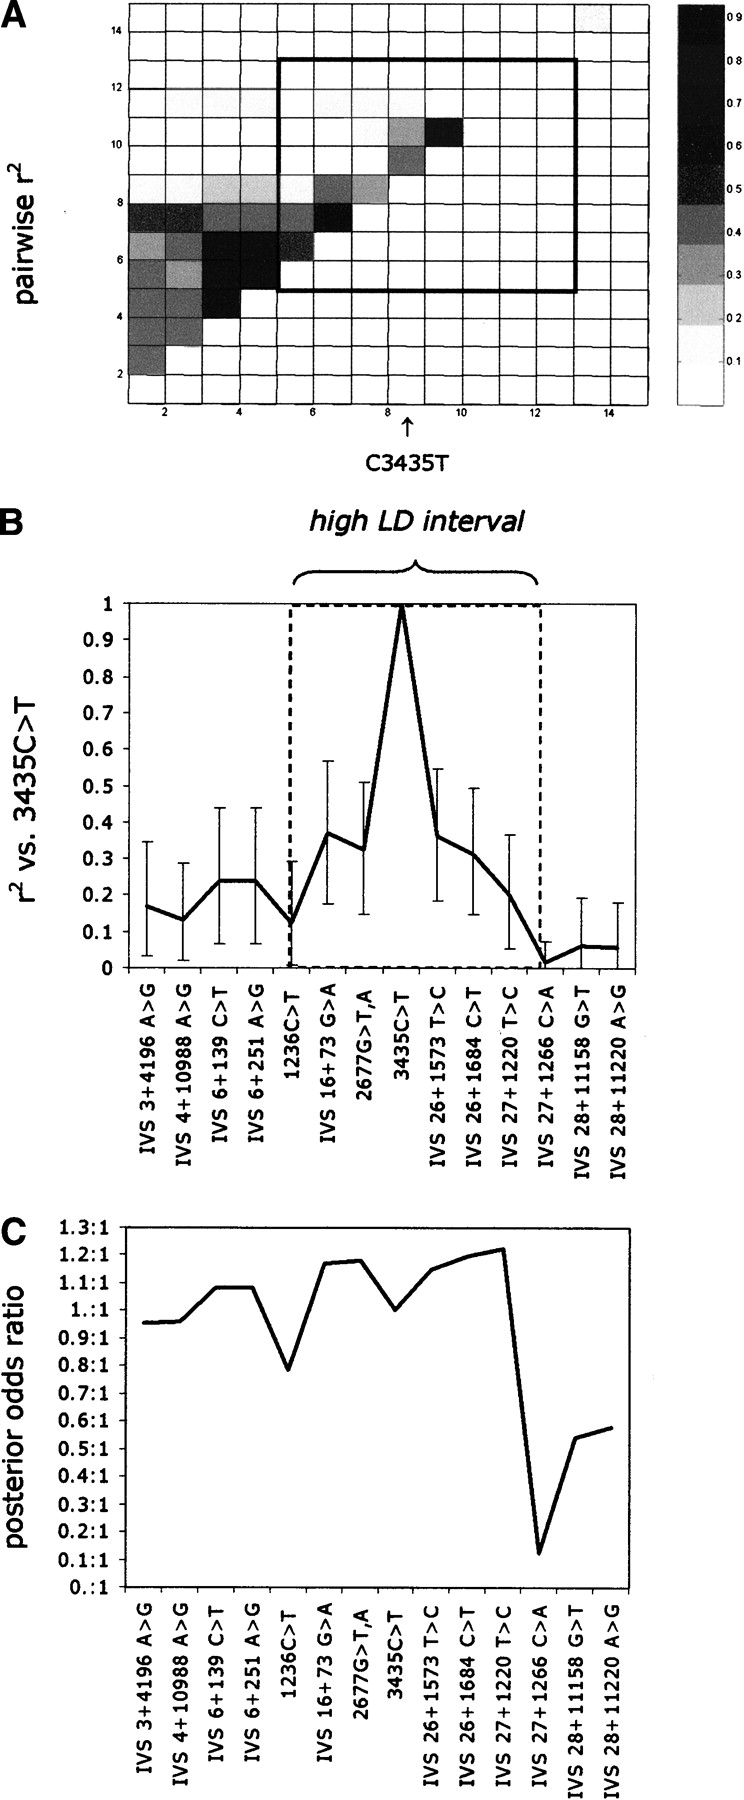
(A) Graph of pairwise r2 measures of LD among the 14 high-frequency (>6%) ABCB1 SNP loci described in Table 1. (B) r2 for 3435C>T against each of the remainder SNPs, together with Bayesian 95% credible intervals calculated by the method described in the Supplemental materials. The dashed box identifies the high-LD interval around 3435C>T. All sites upstream of IVS 27+1220 show association with 3435C>T, significant at the 0.001 level (Fisher's exact test). At the loci downstream of this site, we observe no significant association (P > 0.05) with 3435C>T. Throughout the study we used r2 to measure association, to take into account the dependency of LD on allelic frequencies. (C) Graph of posterior odds of each SNP being causal relative to 3435C>T being causal, based on the combined LD data and case control data on 3435C>T (Siddiqui et al. 2003), using the method described in the Supplemental materials.