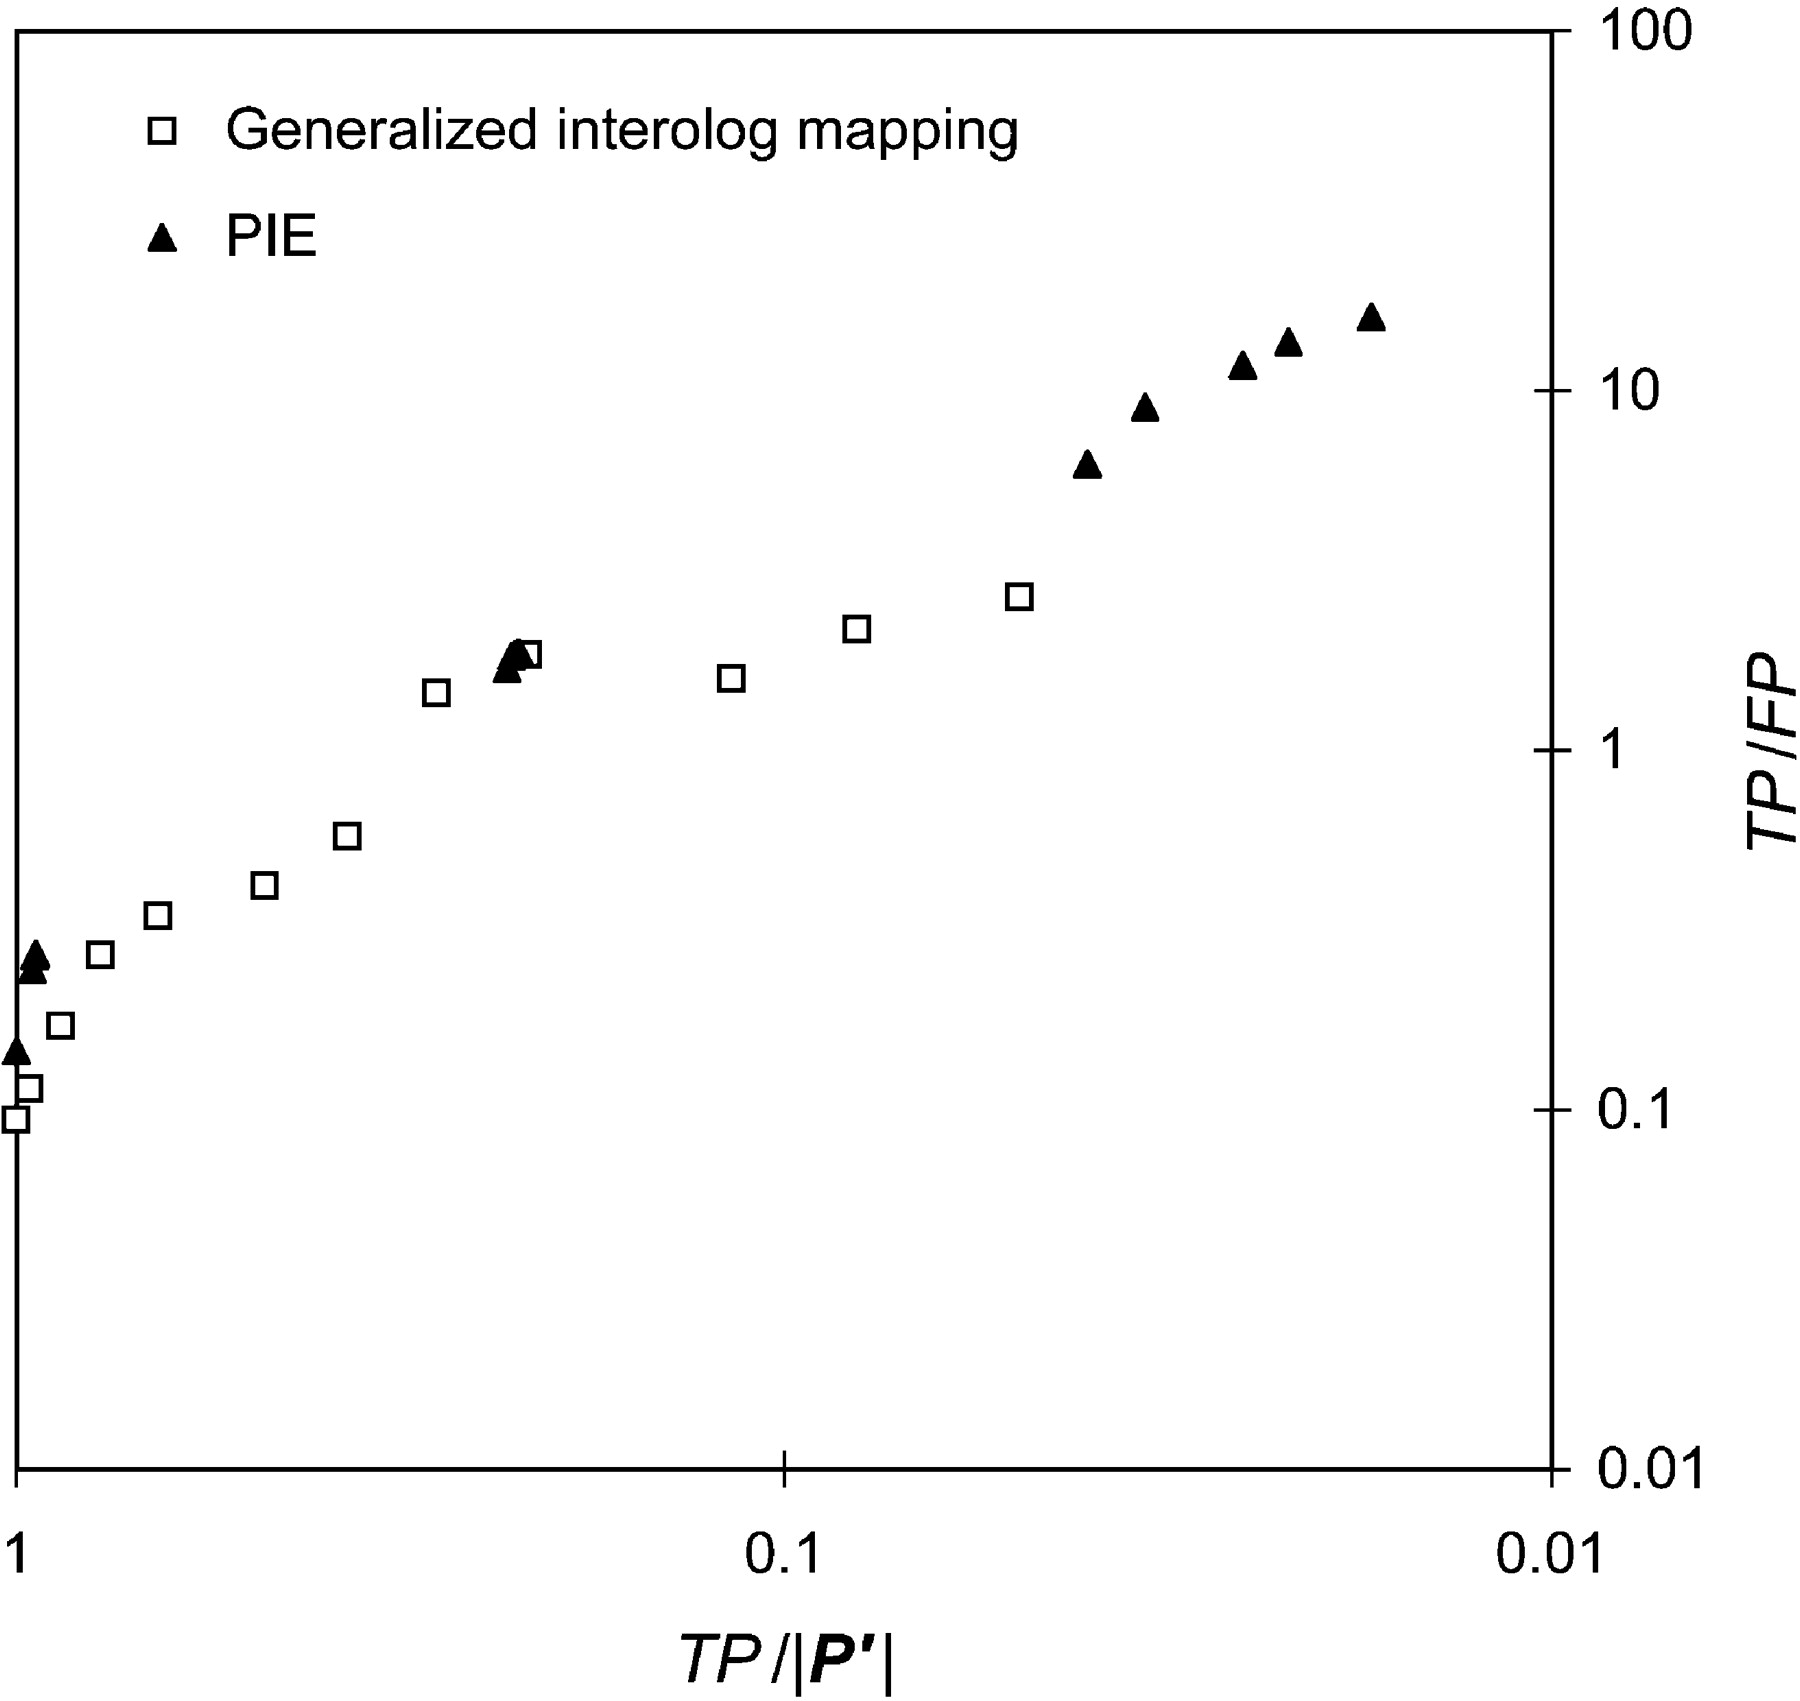
Figure 4
Comparison of generalized interolog mapping with PIE. In this figure, the plot (TP/|P′| versus TP/FP) is analogous to an ROC plot (TP/P vs. FP/N). Based on this curve, the performance of our method is comparable to that of the large-scale experimental data sets.