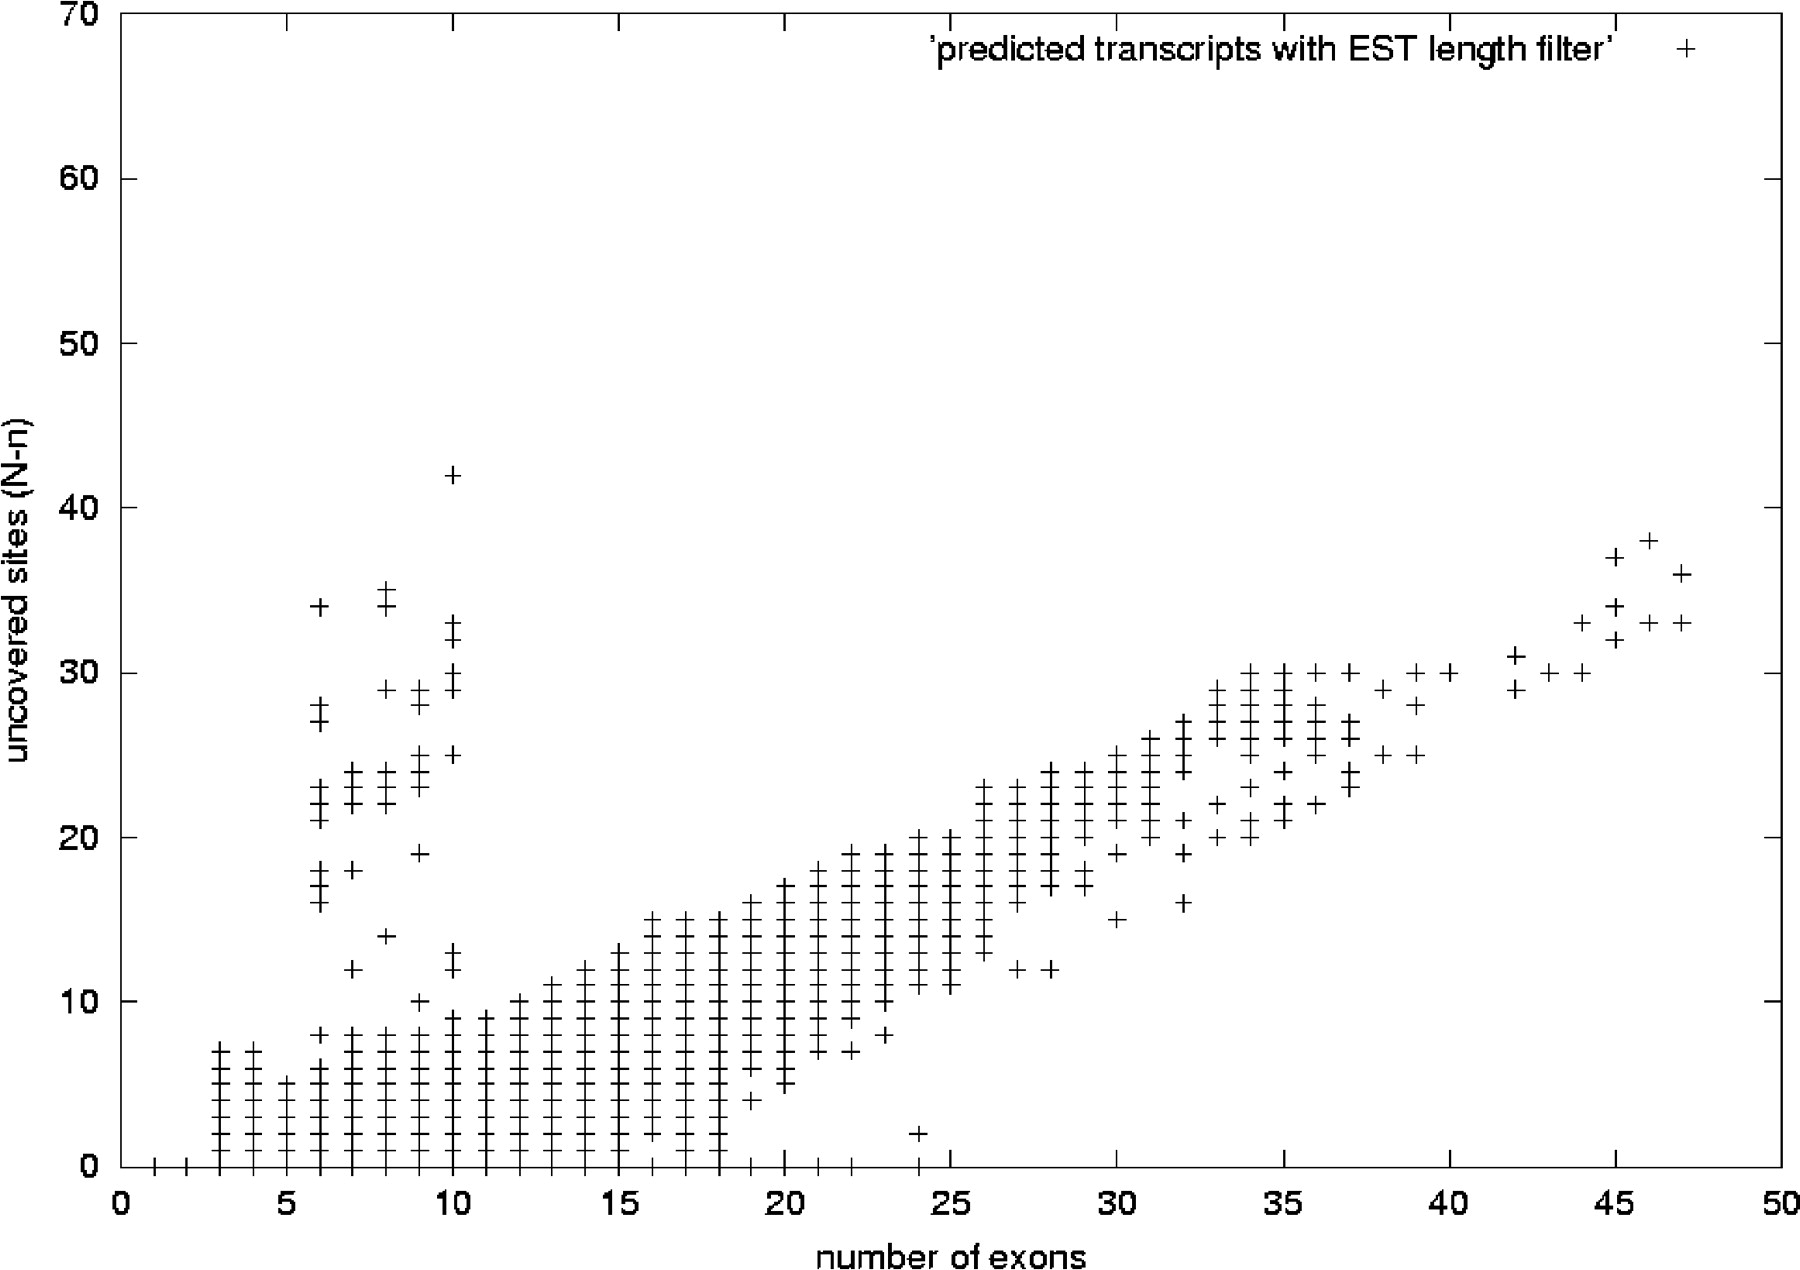
Uncovered sites versus number of exons for predicted mouse transcripts. This figure shows the distribution of mouse predicted transcripts. We have plotted the number of exons in the x-axis and in the y-axis the difference N-n: the difference between the number of sites of alternative splicing N the maximum number of consecutive sites n covered by at least one EST in a transcript. The plot corresponds to the set of 103,664 mouse transcripts predicted by using the same parameters as for the human case shown in Figure 12 and as described in the text: using a redundancy criterion that allows a mismatch of internal exon boundaries no >8bp (case 2 in Fig. 2), and performing a genomic-length filtering on the ESTs. Transcripts along the y = 0 axis are those for which there are ESTs covering all the sites of alternative splicing. As the number of exons grows, N-n increases, as it is less likely to have ESTs covering all the exons. The plot follows the same distribution as the human plot in Figure 12.