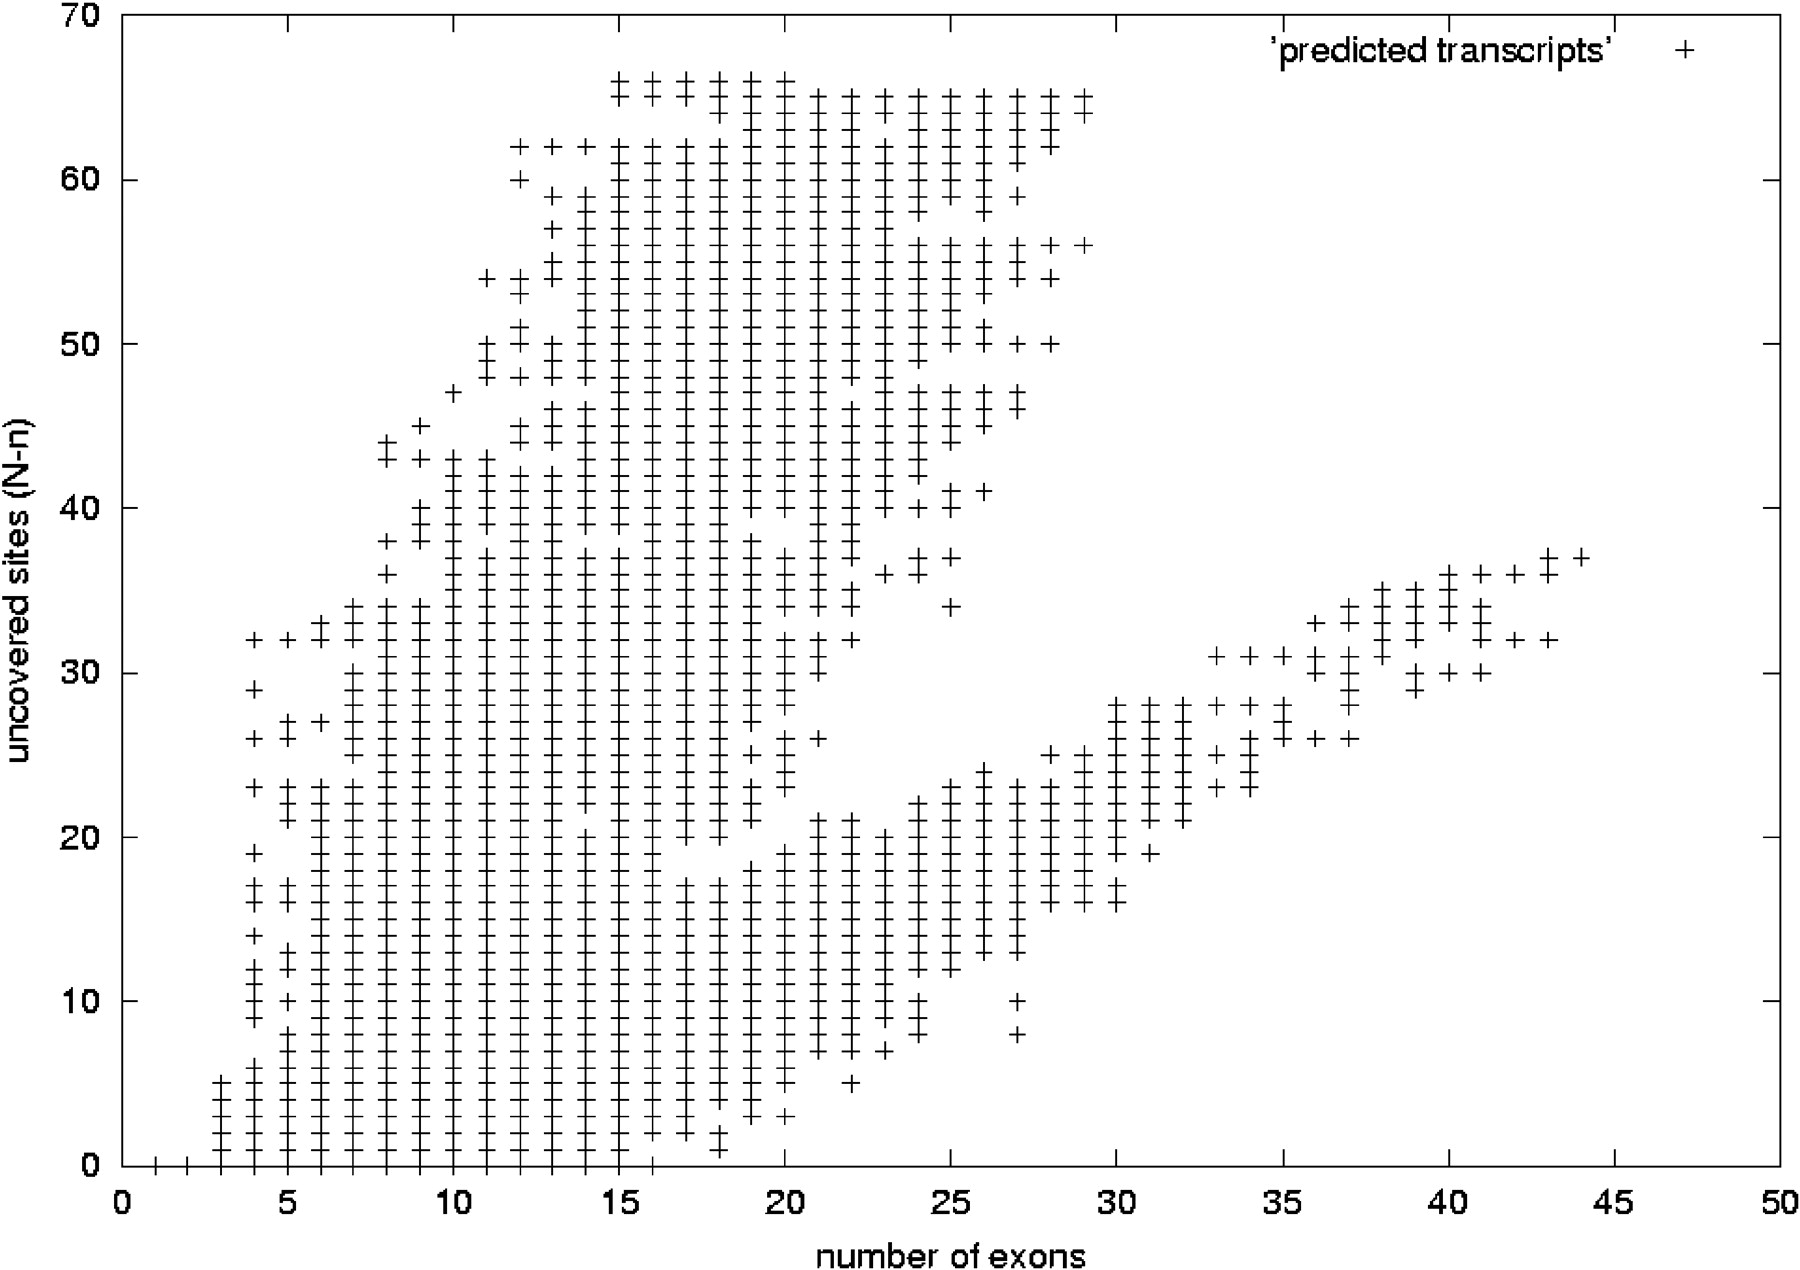
Predicted human transcripts without EST-genomic-length filtering. This figure shows the distribution of predicted human transcripts, with the number of exons in the x-axis and in the y-axis the difference N-n. In this case, the ESTs were not filtered according to their genomic length and the redundancy criterion used imposes exact matching for internal exon boundaries (case 1 in Fig. 2). These data are not described in the text and correspond to approximately double the number of transcripts plotted in Figure 12. As expected, N-n increases as the number of exons grows. In this case, there is a branch for which the difference N-n increases more rapidly with the number of exons and another branch for which this value increases in the same way as in Figure 12. We argue that on this plot, the set with faster growing N-n values is mainly produced by very short ESTs, which give rise to highly chimeric transcripts; hence, they are a less reliable set of trascript predictions. Comparing this figure with Figure 12 shows that by performing the genomic-length–based filtering and allowing some mismatch in the internal exon boundaries, we keep the good distribution of transcripts.