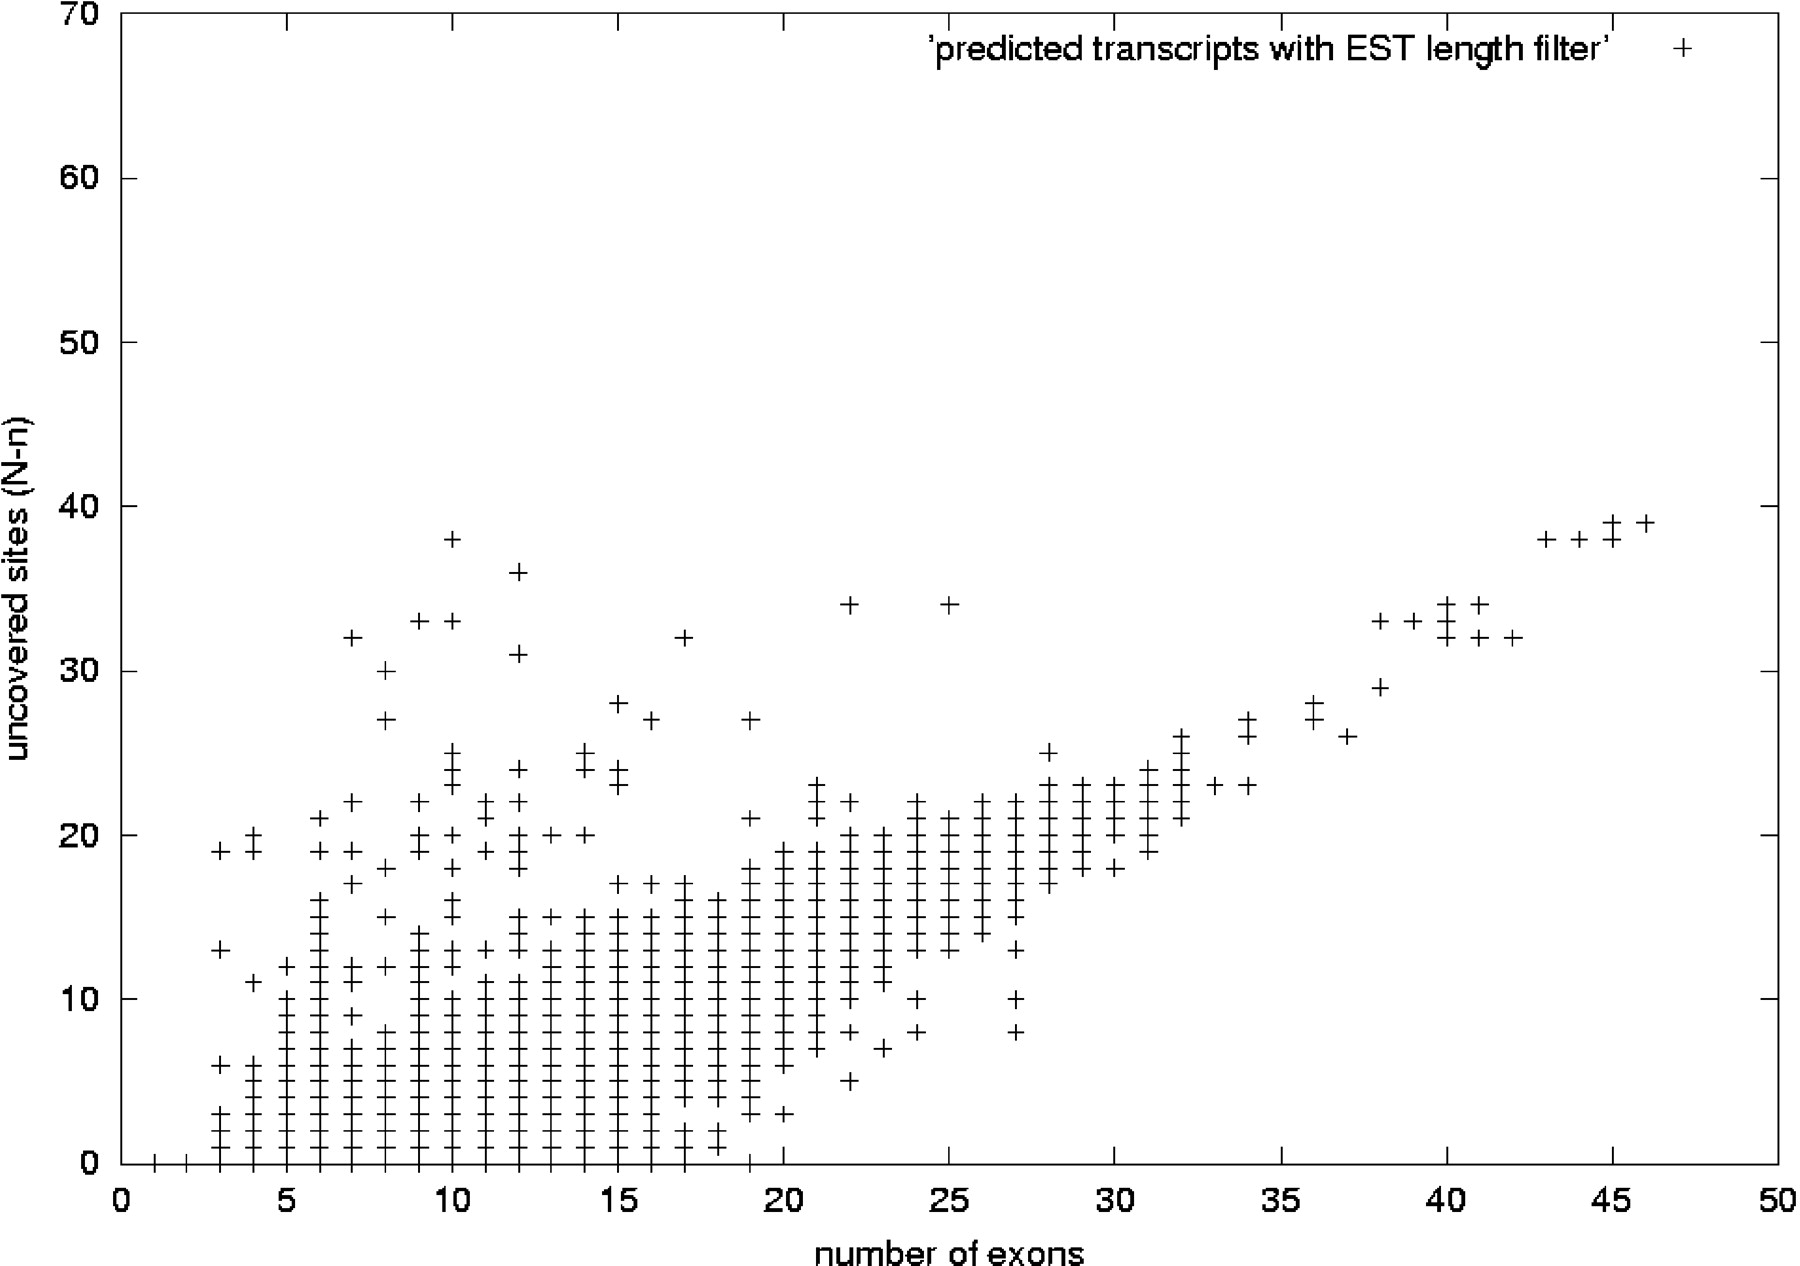
Uncovered sites versus number of exons for predicted human transcripts. This figure shows the distribution of predicted human transcripts. We have plotted the number of exons in the x-axis and in the y-axis the difference N-n: the difference between the number of sites of alternative splicing N in a transcript and the maximum number of consecutive sites n in that transcript covered by at least one EST. The value N-n is related to the confidence value described in the text, namely, confidence = 2-(N-n). The plot corresponds to the set of 122,247 human transcripts predicted as described in the text: using a redundancy criterion that allows a mismatch of internal exon boundaries no >8 bp (case 2 in Fig. 2), and performing a genomic-length filtering on the ESTs. Transcripts along the y = 0 axis are those for which there are ESTs covering all the sites of alternative splicing. As the number of exons grows, N-n increases, as it is less likely to have ESTs covering all the exons in the transcript variant.