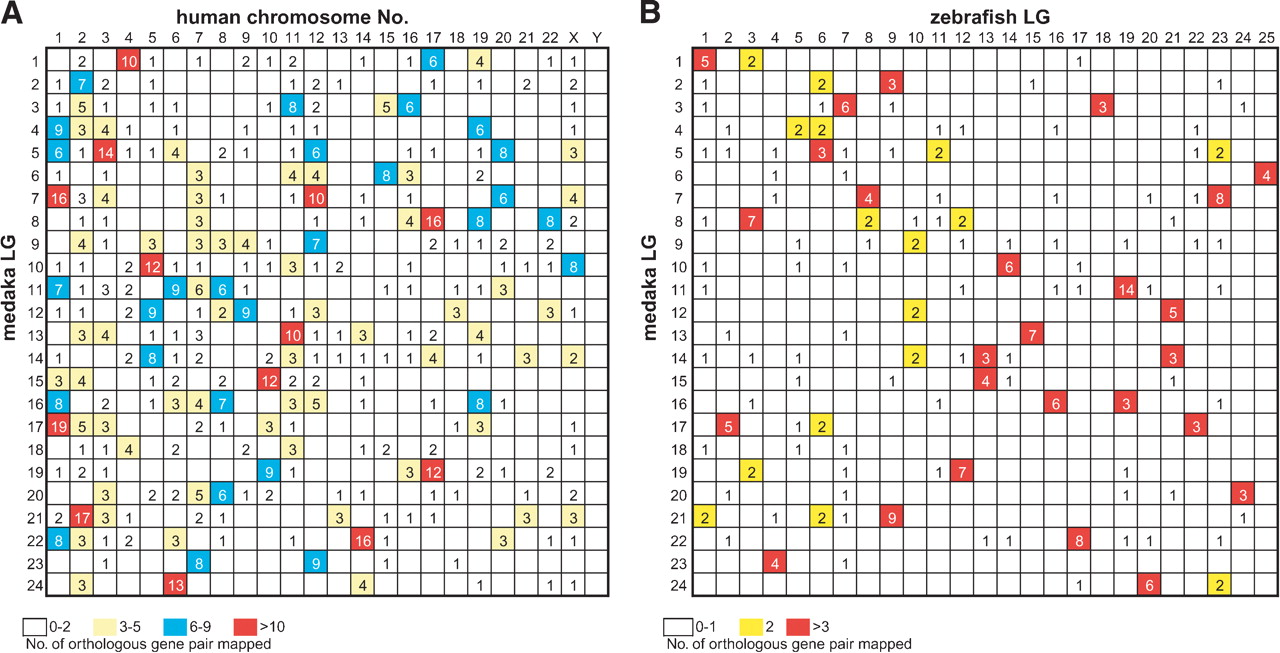
Figure 2
This Oxford grid display is a matrix of cells comparing the number of orthologous genes on chromosomes of two species. Each cell represents two chromosomes, one from each species. The chromosomes of one species are arrayed as columns, with the chromosome numbers and species' name at the top of the grid. The second species' chromosomes are shown in rows, with the chromosome numbers and species' name appearing on the left side of the grid. Numbers in cells indicate the numbers of orthologous genes mapped human–medaka comparison (A) and medaka–zebrafish comparison (B). Details of mapped genes are listed in Supplemental Table 1.