Figure 7
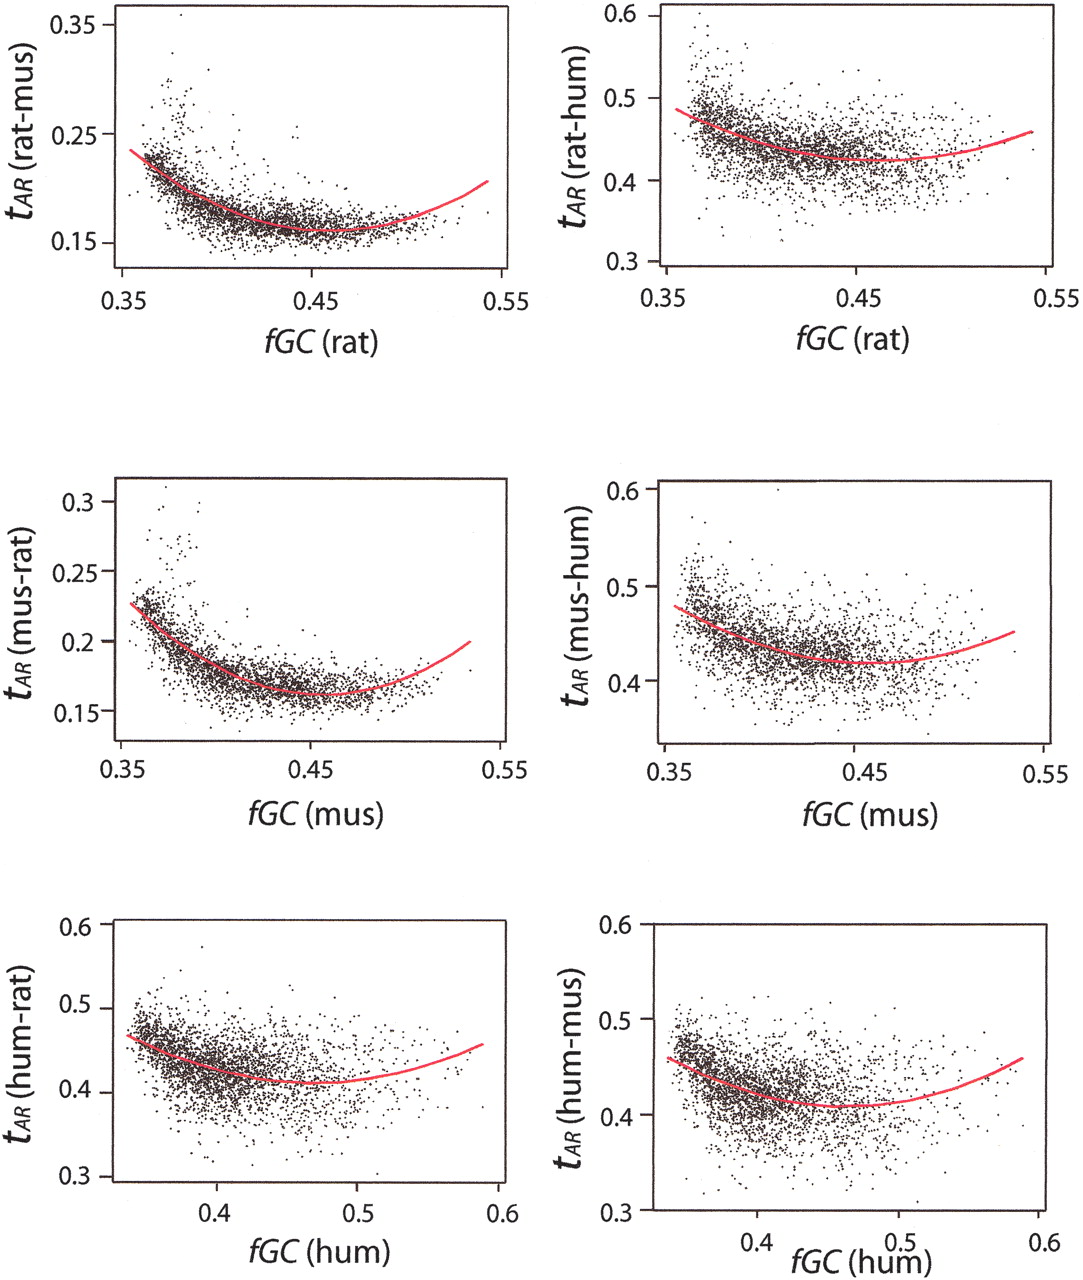
Scatter plots of tAR against GC content of the window (fGC) in alignments among rat, mouse, and human for 1-Mb nonoverlapping windows. A quadratic fit (red curve) is superimposed on each plot.
Scatter plots of tAR against GC content of the window (fGC) in alignments among rat, mouse, and human for 1-Mb nonoverlapping windows. A quadratic fit (red curve) is superimposed on each plot.