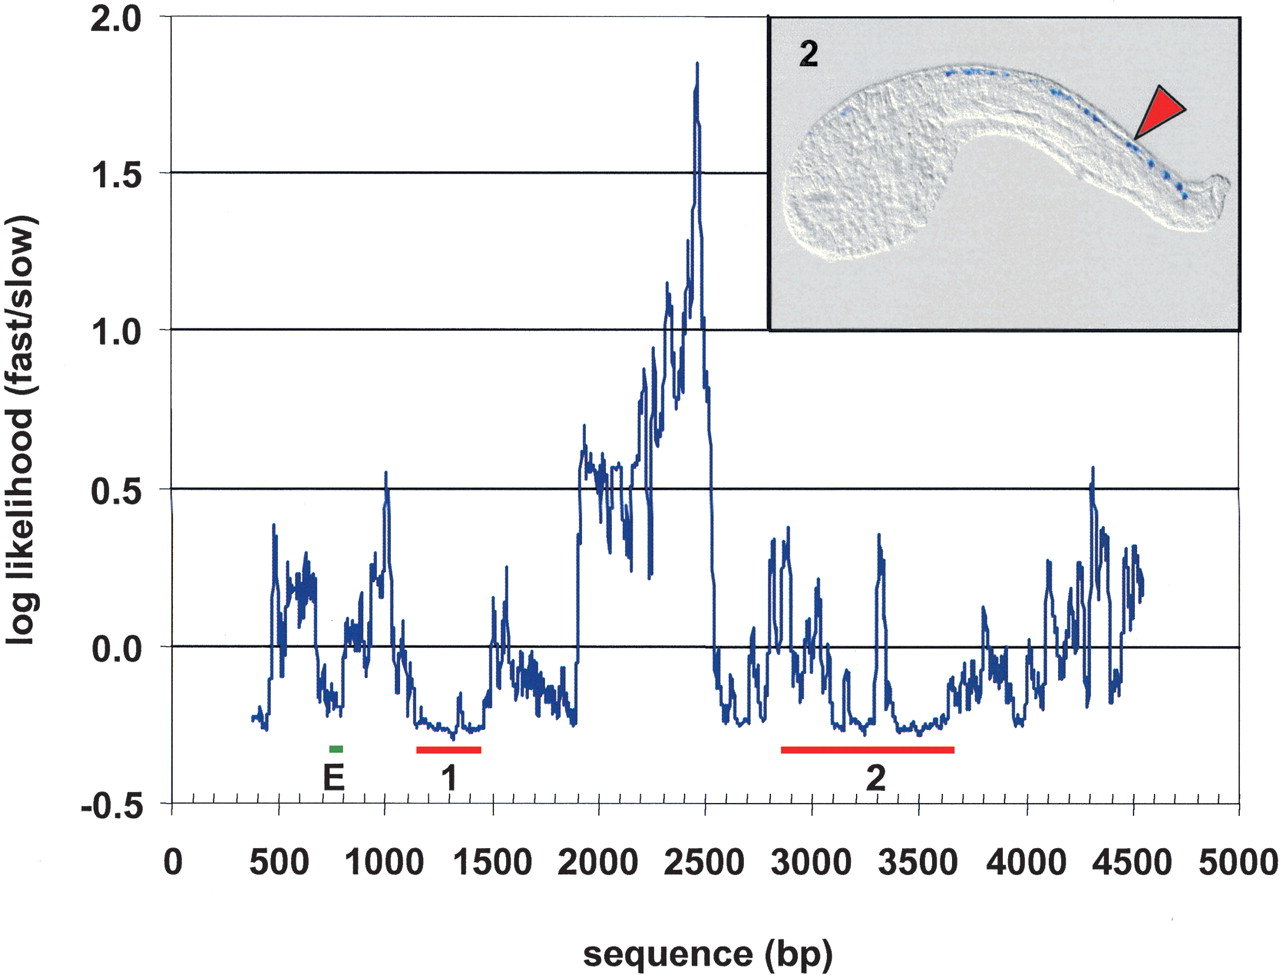
Figure 3.
Mutation rate analysis of the genomic interval containing the 5′ region and the first exon of the snail gene. The plot was drawn as described in the Figure 2 legend. The sequence of 37 individuals (total tree length = 0.52) was used to generate this plot. The position of the first exon is indicated by the green bar labeled “E”; region 1 is snail's promoter, and region 2 is a constrained interval upstream of snail. The inset shows the transgenic analysis of region 2. C. intestinalis larvae were electroporated with a reporter construct containing region 2, and the expression was visualized by histochemical staining with X-gal. The red arrow indicates expression in the neural tube.