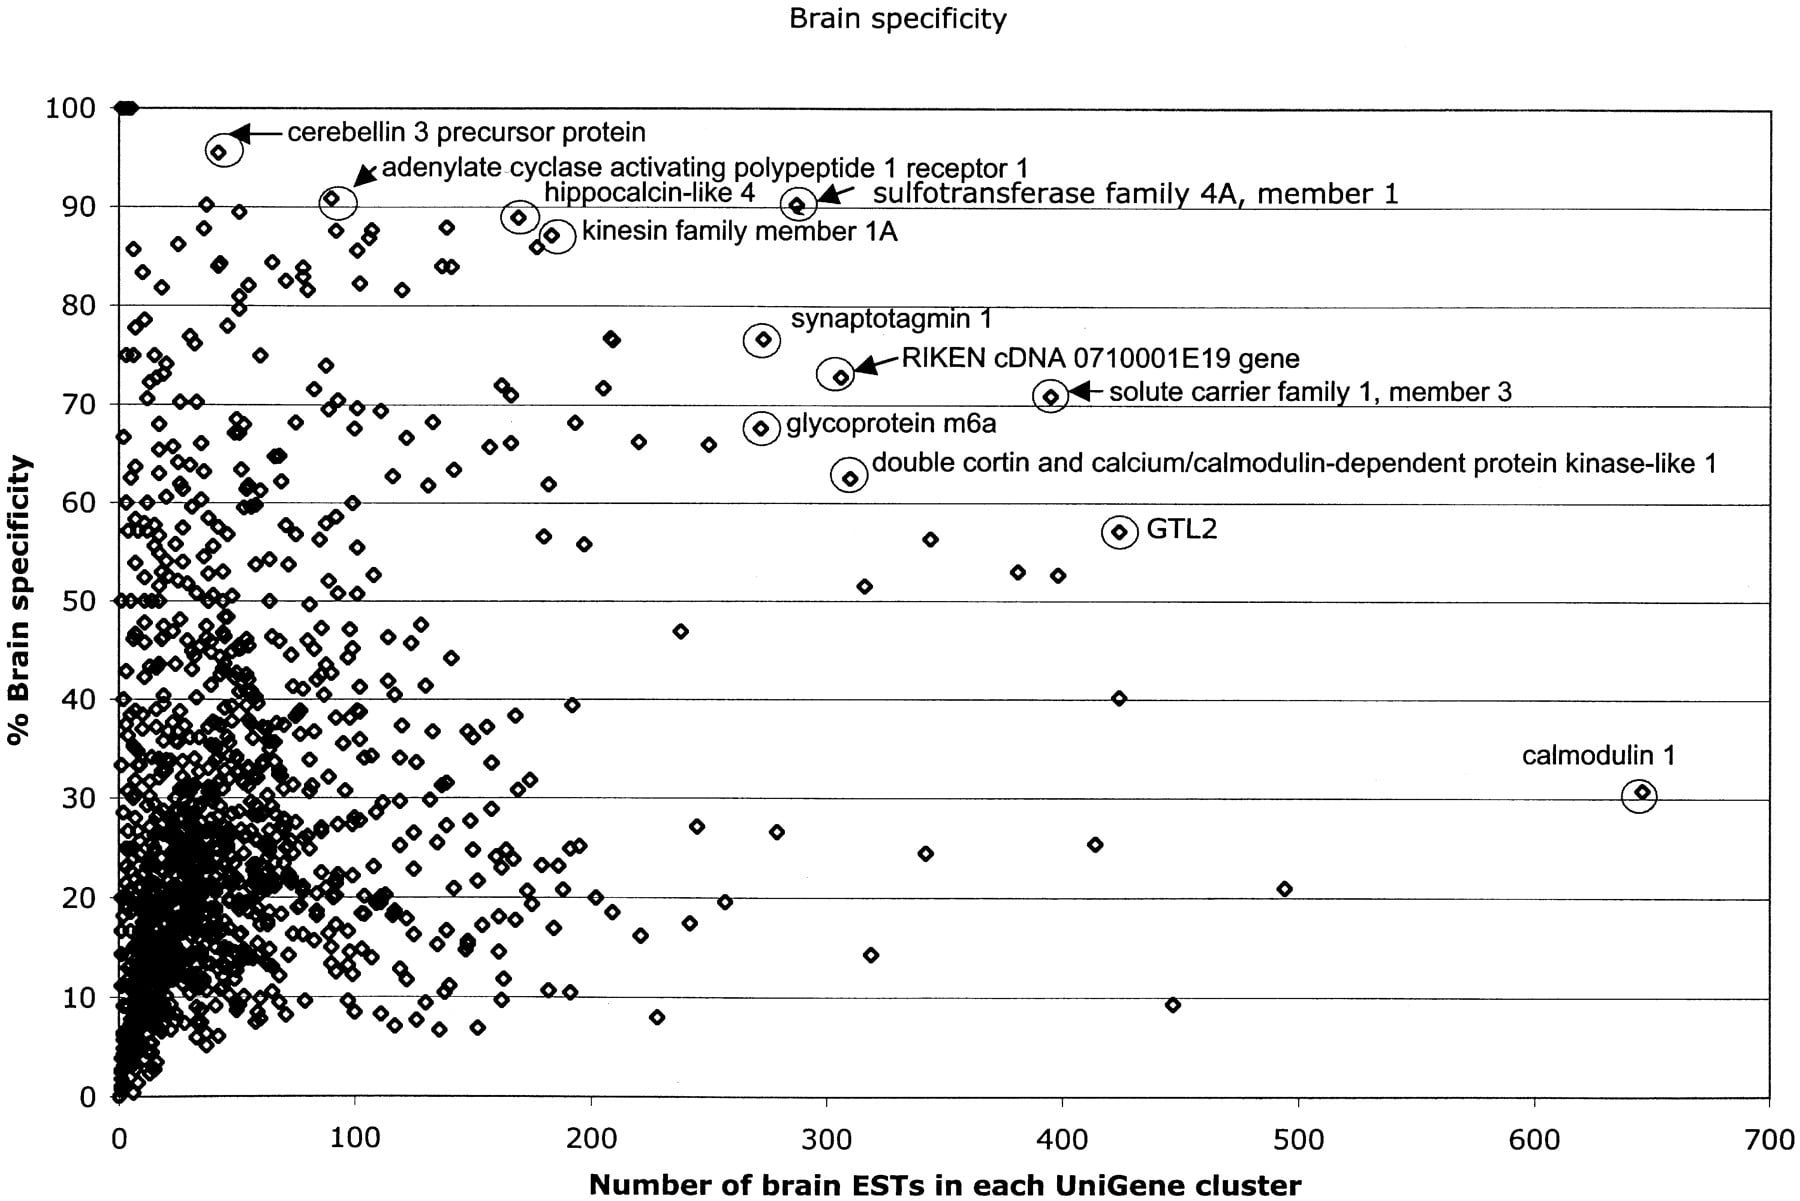
Figure 4
Graph of brain-specific versus EST composition. Gene identities were annotated for several of the most prevalent and most brain-specific clusters.
Graph of brain-specific versus EST composition. Gene identities were annotated for several of the most prevalent and most brain-specific clusters.