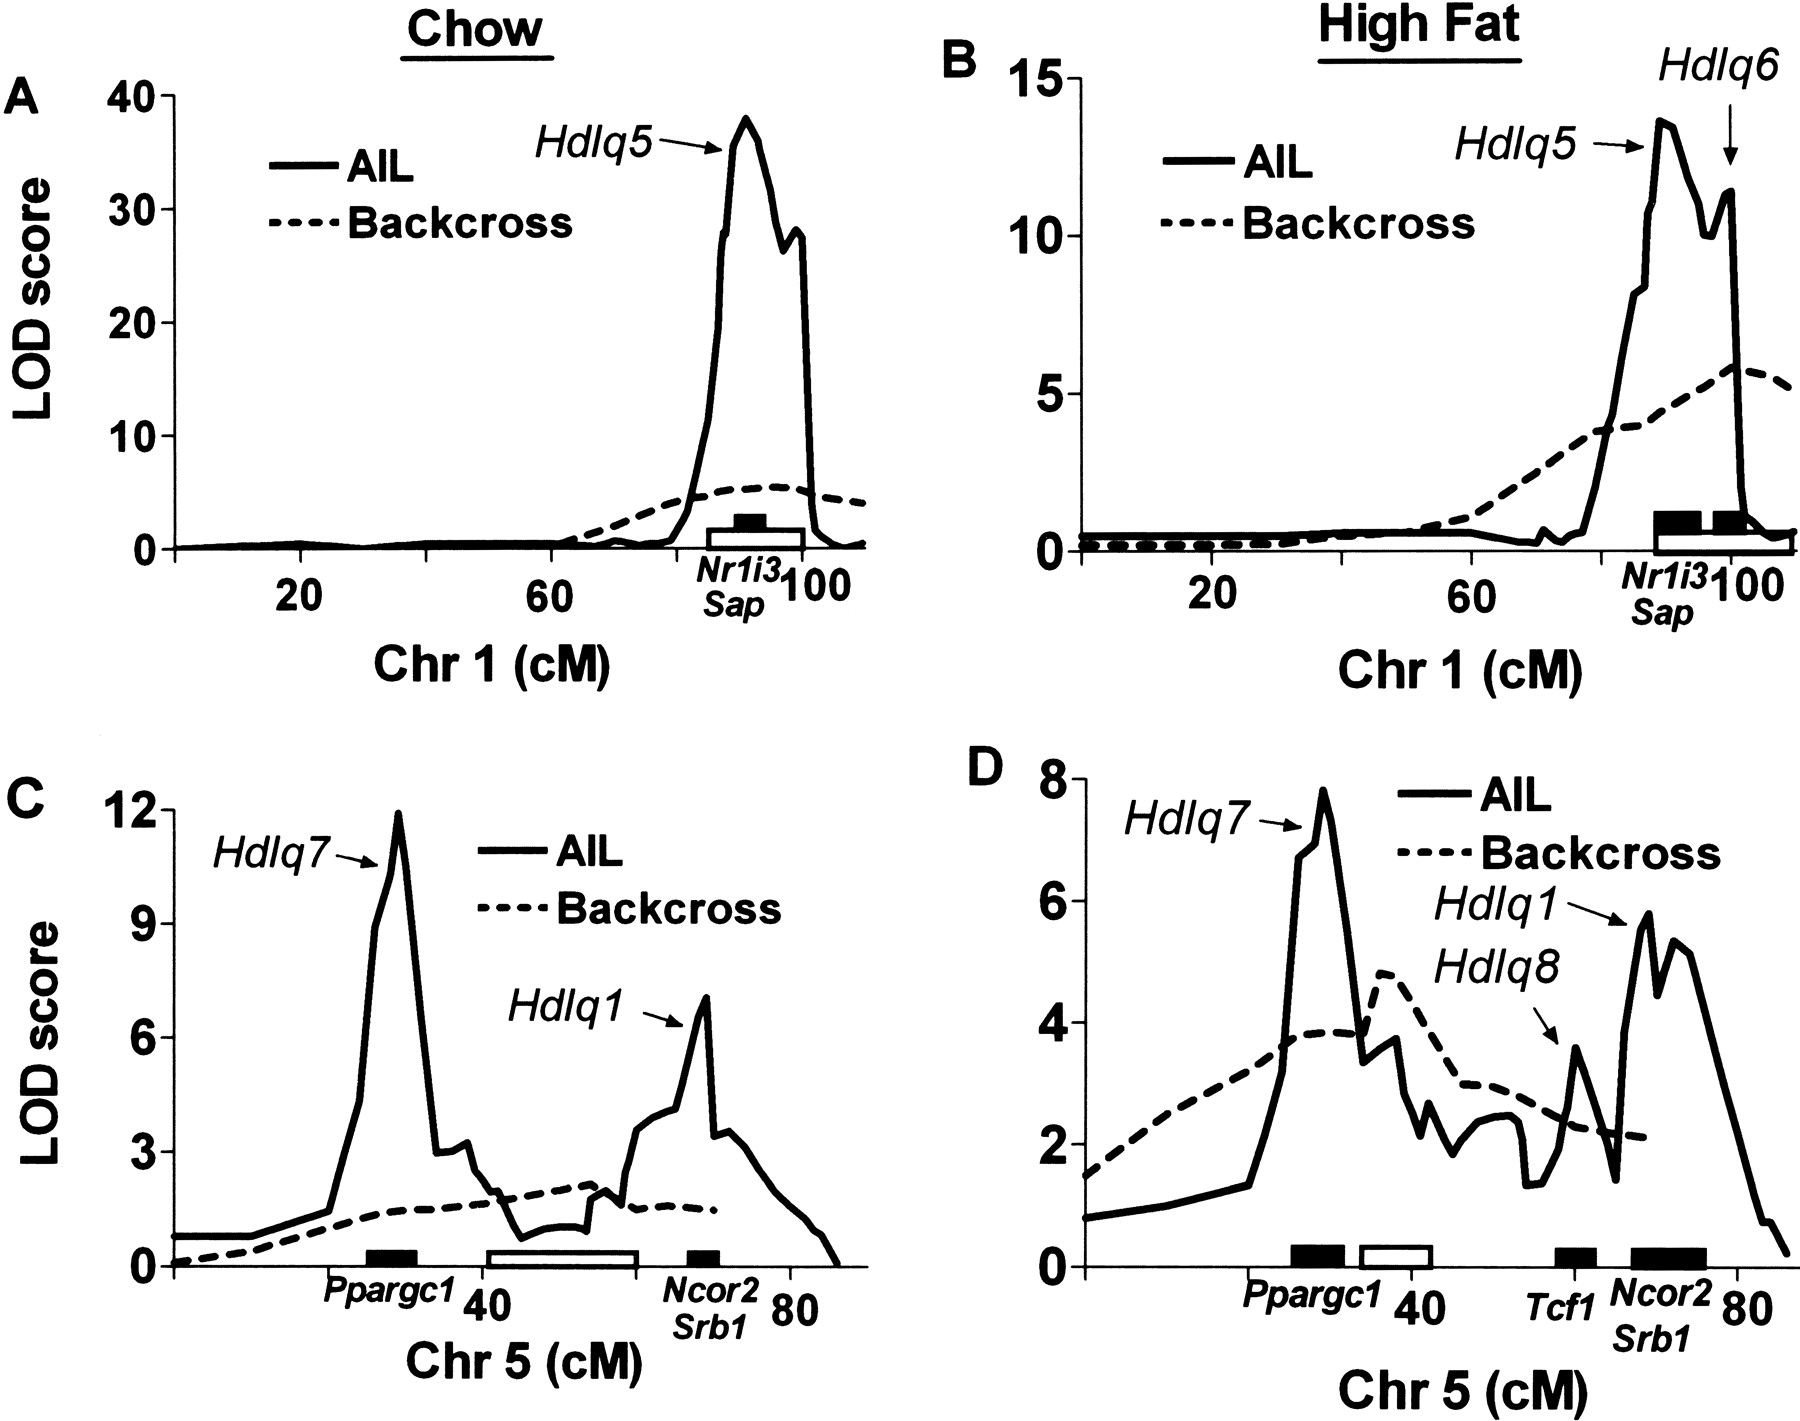
Figure 5
Comparison of QTLs detected in the (B6 × NZB)F1 × B6 backcross and (B6 × NZB)F11 AIL. The fine scans compare the Chr 1 HDL QTLs (A, in chow-fed progeny; B in high fat-fed progeny) and Chr 5 HDL QTLs (C in chow-fed progeny; D in high fat-fed progeny) identified in the backcross (dashed line) and AIL (solid line) progeny. The Y-axis indicates LOD ratio scores, and the X-axis indicates chromosome positions. Solid bars along the X-axis represent 95% confidence intervals (CIs) for the AIL QTLs, and the open bars represent the 95% CI for the backcross QTLs, calculated according to the posterior probability densities of the QTL locations. Some candidate genes are shown along the X-axis.